IBM SPSS Statistics is a software package that is geared towards the social sciences like federal and local governments and health care organizations. The software works similarly to Microsoft Excel, with a spreadsheet style entry field and easy-to-use toolbar. However, data entry in SPSS statistics is somewhat different, with columns used for variables.
SPSS Tutorial for Beginners Collection
This SPSS tutorial for beginners collection gives you the basic tools to get you started with SPSS in a step-by-step format. You’ll find an introduction to the topic, videos and pictures to illustrate the points.
Watch the video for an introduction to SPSS, or read on below.

Can’t see the video? Click here to watch it on YouTube.
BASICS:
- How to Enter Data into SPSS and Define Variables
- SPSS Compute Variable.
- Descriptive Statistics SPSS
- Excel to SPSS: How to Import Data
- SPSS Ordinal, Interval, and Scale
- How to Find the SPSS Mean Mode Median
- How to Find the SPSS Five Number Summary
- Missing Values in SPSS
- How to Find the Interquartile Range in SPSS
- Outliers SPSS
- How to Find the Standard Deviation in SPSS
- How to Make an SPSS Frequency Table.
- How to Make an SPSS Histogram.
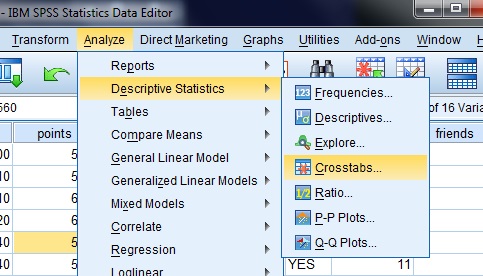
- How to Make Crosstabs in SPSS (Contingency Tables).
- How to Make a Bar Chart in SPSS
- How to Make an SPSS Boxplot
- How to Make an SPSS Scatterplot
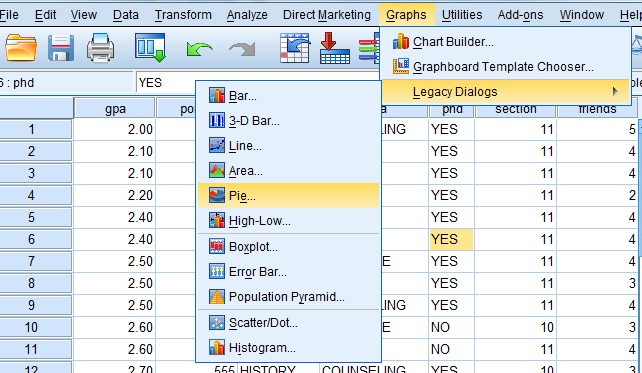
- How to Make a Pie Chart in SPSS
- Z Scores in SPSS
CORRELATIONS:
TESTS:
- Fisher’s Exact Test in SPSS
- K-S Test in SPSS
- One sample t test in SPSS
- Tests for Normality in SPSS
- How to Run an Independent Samples t test in SPSS
- Levene’s Test in SPSS
- Omega Squared SPSS
- Paired Samples T Test in SPSS
- How to Perform a Chi-Square Goodness of Fit Test in SPSS
- One Way ANOVA in SPSS
- Shapiro-Wilk Test for Normality in SPSS
- Two Way ANOVA in SPSS
- ANCOVA in SPSS
- How to Run a MANCOVA in SPSS
- Runs Test SPSS
About SPSS
The program, originally called Statistical Package for the Social Sciences, was released in 1968 and quickly became one of the most widely used statistics programs in the social sciences, including in healthcare, government, market research and surveying.
Major differences Between Microsoft Excel and SPSS
Both Excel and SPSS have a similar feel, with pull-down menus, a host of built-in statistical functions and a spreadsheet format for easy data entry. However, SPSS is specifically built for statistics and surpasses Excel in many ways, including:
- Faster and easier basic function access like descriptive statistics (i.e. mean, standard deviation or median). While Excel does have built-in functions, SPSS has these basic statistics elements in pull down menus.
- Wider variety of graphs and charts in SPSS. Excel does have a wide range of basic charts, but if you want to create complex graphs like contingency tables, this is much easier in SPSS with the pull-down menus.
- Easier to find statistical tests. While Excel does have a wide range of statistical tests built-in, the pull-down menus in SPSS make for faster access.
There are several disadvantages to using SPSS—especially for the casual learner—including the hefty price tag (at time of writing, a full version of IBM Statistics SPSS Standard costs over 5K!). Therefore, unless you are attached to a university or other organization that has already purchased a multi-user license, you’re unlikely to find the program on a personal computer.
Check out our Youtube channel for a full range of SPSS tutorial videos.