- Standard Deviation (SD) Definition
- How to Find the Sample SD by Hand
- Standard Deviation for a Binomial
- Discrete Random Variable SD
- Standard Deviation for a Frequency Distribution
- How to find the SD using technology:
Standard Deviation Definition
Standard deviation (SD) is a measure of the amount of variation in a set of values. A low SD—close to zero—indicates that the values tend to be close to the mean of the set, while a high SD indicates that the values are spread out over a wider range. For example, are all the data points close to the mean (i.e., the data has a small SD)? Or are lots of scores far above (or far below) the mean score (i.e., a large SD)? 
Standard deviation is most commonly represented by:
- The lowercase Greek letter σ (sigma) for the population standard deviation
- The lowercase Latin letter s for the sample standard deviation.
What Does it Look Like on a Graph?
The normal distribution is commonly seen in statistics as a tool to understand standard deviation. The following graph of a normal distribution represents a great deal of data in real life.
The mean, or average, is represented by the Greek letter μ, in the center. Each segment (colored in dark blue to light blue) represents one standard deviation away from the mean. For example, 2σ means two standard deviations from the mean. 
A normal distribution curve can represent hundreds of situations in real life. Have you ever noticed in class that most students get Cs while a few get As or Fs? That can be modeled with a bell curve.
People’s weights, heights, nutrition habits and exercise regimens can also be modeled similar graphs. That knowledge enables companies, schools and governments to make predictions about future behavior. For behaviors that fit this type shape (such as performance on the SAT), you’ll be able to predict that 34.1 + 34.1 = 68.2% of students will score very close to the average score, or one standard deviation away from the mean.
How to Find the Sample Standard Deviation by Hand
Watch the video below for a step by step guide, or read on below:
Find by Hand
When you’re running an experiment (or test, or survey), you’re usually working with a sample— a small fraction of the population. The formula to find the standard deviation (s) when working with samples is: 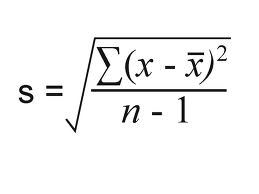
The Σ sign in the formula means “to add up” (see: Sigma notation). To solve the formula,
- Add the numbers,
- Square them,
- Then divide.
It sounds simple, but it gets tedious when working with larger sample sizes (because you have to add and square multiple times). The example problem below has just 9 data points, but should give you a good example of how tedious the hand calculations can be. If you do have to calculate it by hand (for homework or a test), make sure to use a calculator to check your answer.
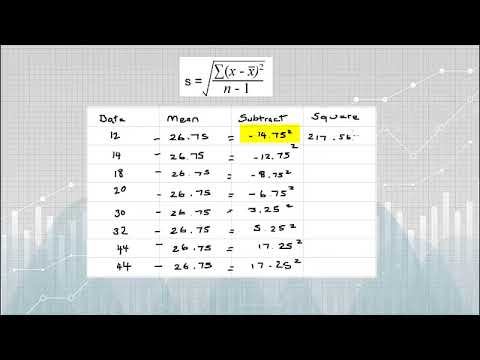
Example Problem:
Q. Find the standard deviation for the following results: {12, 15, 17, 20, 30, 31, 43, 44, 54}
- Add the numbers up: 12 + 15 + 17 + 20 + 30 + 31 + 43 + 44 + 54 = 266.
- Square the answer from Step 1: 266 x 266 = 70756
- Divide your answer from Step 2 by the number of items (n) in your set. In this example, we have 9 items, so: 70756 / 9 = 7861.777777777777 (dividing by n) Set this number aside for a moment. You’ll need it in a later step.
- Square the original numbers {12, 15, 17, 20, 30, 31, 43, 44, 54} one at a time, then add them up: (12 x 12) + (15 x 15) + (17 x 17) + (20 x 20) + (30 x 30) + (31 x 31) + (43 x 43) + (44 x 44) + (54 x 54) = 9620
- Subtract Step 4 from Step 3. 9620 – 7861.777777777777 = 1758.2222222222226 Notice that I’m not rounding yet. You should keep all of your decimal places until the very end, then you can round. Rounding in the middle will lead to your answer being off just enough to get an incorrect textbook answer. Set this number aside for a moment.
- Subtract 1 from n. We have 9 items, so n = 9: 9 – 1 = 8
- Divide Step 5 by Step 6 to get the variance: 1758.2222222222226 / 8 = 219.77777777777783
- Take the square root of Step 7: √(219.77777777777783) = 14.824903971958058 The standard deviation is 14.825.
Standard Deviation for a Binomial
(Click to Skip to Section) Standard Deviation For a Binomial: TI-83 Standard Deviation For a Binomial: by hand
TI 83 Standard Deviation For a Binomial
The TI 83 doesn’t have a built in function to find the standard deviation for a binomial. You have to enter the equation in manually. ![]()
Example problem: Find standard deviation for a binomial distribution with n = 5 and p = 0.12.
- Subtract p from 1 to find q. 1 – .12 ENTER =.88
- Multiply n times p times q. 5 * .12 * .88 ENTER =.528
- Find the square root of the answer from Step 2. √.528 = =.727 (rounded to 3 decimal places).
Standard Deviation For a Binomial: By Hand

A binomial distribution is one of the simplest types of distributions in statistics. It’s a type of distribution where there is either success, or failure. For example, winning the lottery: or not winning the lottery. You can find the standard deviation for a binomial distribution in two ways:
- With a formula
- With a probability distribution table (scroll down for the steps)
The formula to find the standard deviation for a binomial distribution is: ![]()
Example question:
Find the standard deviation for the following binomial distribution: flip a coin 1000 times to see how many heads you get.
- Identify n and p from the question. N is the number of trials (given as 1000) and p is the probability, which is .5 (you have a 50% chance of getting a heads in any coin flip).
- Insert those numbers into the formula and solve.
If formulas aren’t your forte, follow these additional steps:
- Multiply n by p: 1000 * .5 = 500.
- Subtract “p” from 1: 1 – .5 = .5.
- Multiply Step 2 by Step 3: 500 * .5 = 250.
- Take the square root of Step 4: √ 250 = 15.81.
That’s it!
Standard Deviation of Discrete Random Variables
With discrete random variables, sometimes you’re given a probability distribution table instead of “p” and “n”. As long as you have a table you can calculate the standard deviation of discrete random variables with this formula: ![]() Example question: Find the standard deviation of the discrete random variables shown in the following table, which represents flipping three coins:
Example question: Find the standard deviation of the discrete random variables shown in the following table, which represents flipping three coins: ![]()
- Find the mean (this is also called the expected value) by multiplying the probabilities by x in each column and adding them all up: μ = (0 * 0.125) + (1 * 0.375) + (2 * 0.375) + (3 * 0.125) = 1.5
- Work the inner part of the above equation, without the square root:
- ((0 – 1.5)2 * 0.125 ) +
- ((1 – 1.5)2 * 0.375 ) +
- ((2 – 1.5)2 * 0.375 ) +
- ((3 – 1.5)2 * 0.125 ) +
- = 0.75
- Take the square root of Step 2: σ = √ 0.75 = 0.8660254.
That’s it!
Standard Deviation for a Frequency Distribution
Watch the video for an overview of the standard deviation for a frequency distribution, or read on below.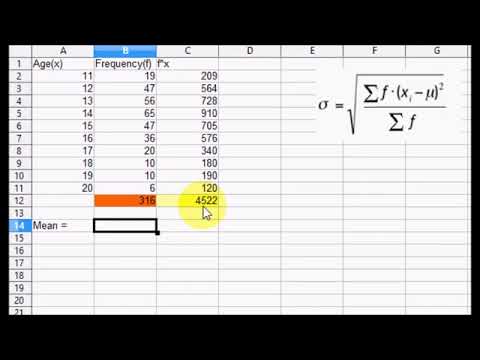
The formula to find the standard deviation for a frequency distribution is: 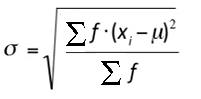
Where:
- μ is the mean for the frequency distribution,
- f is the individual frequency counts,
- x is the value associated with the frequencies.
How to find the Standard Deviation in Minitab
Example question: Find the standard deviation in Minitab for the following data: 102, 104, 105, 110, 112, 116, 124, 124, 125, 240, 245, 254, 258, 259, 265, 265, 278, 289, 298, 311, 321, 321, 324, 354
- Type your data into a single column in a Minitab worksheet.
- Click “Stat”, then click “Basic Statistics,” then click “Descriptive Statistics.”
- Select the variables you want to find the standard deviation for and then click “Select” to move the variable names to the right window.
- Click the “Statistics” button.
- Check the “Standard deviation” box and then click “OK” twice. The standard deviation will be displayed in a new window.
That’s it!
How to find the Standard Deviation in SPSS
The tool to calculate standard deviation in SPSS is found in the “Analytics > Descriptive Statistics” section of the toolbar. You can also use the “Frequencies” option in the same menu. If you have already typed in your data into a worksheet, skip to Step 3.
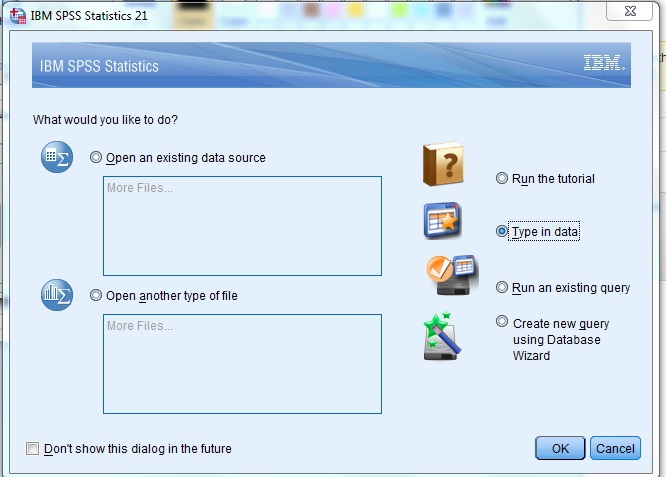
- Open a new worksheet to type in data. Once SPSS opens, select the “type in data” radio button to the right of the “What would you like to do” dialog box.

- Type your data into the worksheet. You can use as many columns as you like to enter data, but don’t leave any blank rows between your data.
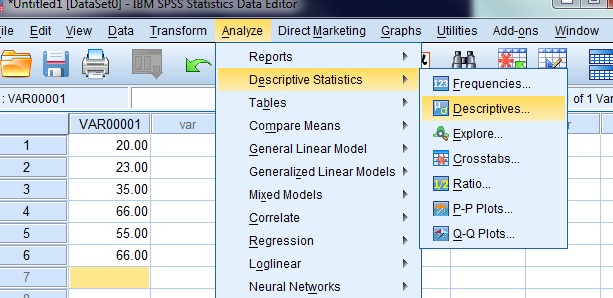
- Click “Analyze” on the toolbar and then mouse over “Descriptive Statistics.” Click “Descriptives” to open the variables dialog box.

- Select the variables you want to find descriptive statistics for. SPSS needs to know where the data is that you want to calculate the standard deviation for. The system will populate the left box with possibilities (columns of data that you entered) but you will need to select which variables you want to include and transfer those lists to the right box. To transfer the lists, click the center arrow to move those variables from the left box to the right box.
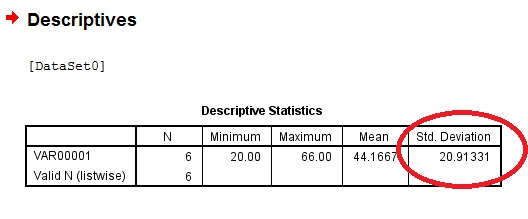
- Check the “Standard Deviation” box, then click “OK”. The answer will show to the right of the window, in the last column headed “std deviation.”
 Back to Top
Excel
Notes for Mac: For Standard Deviation for an entire Population (σ) use: STDEV.P(A1:A10) For Standard Deviation of a Sample (a fraction of the population) use: STDEV.S(A1:A10)
Excel 2013 & up
There are two different ways you can find the standard deviation:
- The STDEV function.
- The Data Analysis Toolpak.
Consider installing the Data Analysis Toolpak, especially if you’re going to be performing multiple data analyses on your data.
1. STDEV function
- Type the data into one column. For example, column A.
- Click in any empty cell.
- Type “=STDEV(A1:A99)”—where A1:A99 are the cell locations of your data.
- Click “OK.”
2. The Toolpak
- Click the “Data” tab, then click “Data Analysis.”
- Click on “Descriptive Statistics,” then click “OK.”
- Click the Input Range box, then input where your data is. For example, if you typed your data into cells B1 to B50, then type “B1:B50” into the box.
- Choose the Rows or Columns radio button. This depends on how you input your data.
- Click the “Labels in first row” box if your data has column headers. A column header is the first box in a column (e.g. A1, A2, A3…) that has some type of label, like “cats” “specimen” or “moons”.
- Click the “Descriptive Statistics” check box.
- Choose a location for your results. For example, clicking the “New Worksheet” radio button will output your results into a new worksheet.
- Click “OK.”
Which function should I use?
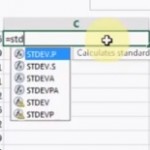 Excel 2013 has SIX functions for the standard deviation:
- STDEV,
- STDEV.P,
- STDEV.S,
- STDEVA,
- STDEVPA
- STDEVP.
Which function you choose depends on whether:
- You’re working with samples or populations.
- You want to evaluate numerical data or other data types (like the binary TRUE and FALSE).
The table below shows the differences between the six types.
| SAMPLE/POPULATION | TYPE OF DATA | COMPATIBILITY*? | FUNCTION |
| SAMPLE | NUMERICAL | NO | =STDEV.S |
| SAMPLE | NUMERICAL | YES | =STDEV |
| SAMPLE | BOTH | N/A | =STDEVA |
| POPULATION | NUMERICAL | NO | =STDEV.P |
| POPULATION | NUMERICAL | YES | =STDEVP |
| POPULATION | BOTH | N/A | =STDEVPA |
*With earlier versions of Excel. Back to Top
TI-89 Calculator
Example problem: What is the sample Standard Deviation for this list? 1, 34, 56, 89, 287, 598, 1001.
- Press HOME.
- Press CATALOG. It’s located below the APPS key in the top middle of your keypad.
- Scroll to stdDev(. Press ENTER.
- Press 2nd, then (. The display should read: stdDev({ .
- Enter the numbers. Make sure to type in commas after each number. The end result should look like this: stdDev({1,34,56,89,287,598,1001
- Press 2nd, then ) twice. This closes the expression: stdDev({1,34,56,89,287,598,1001}).
- Press ENTER to get the solution: 375.149.
Related Articles
History of the standard deviation
The journey of standard deviation’s development has been extensive and complex. Carl Friedrich Gauss, a German mathematician, first introduced the concept of standard deviation in the early 1800s. Considered one of the most influential figures in statistical history, Gauss created standard deviation as a method to measure data dispersion around the mean.
It wasn’t until the early 1900s that standard deviation gained widespread use. During this time, English statistician Ronald Fisher expanded upon the application of standard deviation in hypothesis testing. Fisher demonstrated how standard deviation could be used to compute the probability of obtaining a specific sample mean from a given population mean, making it an invaluable tool for statistical inference.
Today, standard deviation is among the most commonly used statistical measures, applied across various fields such as economics, finance, medicine, and social science. It serves as a potent instrument for understanding data spread and making population inferences.
Key contributors to the history of standard deviation include:
- Carl Friedrich Gauss (1777-1855): The German mathematician who conceived the idea of standard deviation.
- Ronald Fisher (1890-1962): The English statistician who pioneered the application of standard deviation in hypothesis testing.
- William Sealy Gosset (1876-1937): The Irish statistician who developed the student t-distribution, a frequently used distribution for hypothesis testing.
- Jerzy Neyman (1894-1980): The Polish-American statistician who established the Neyman-Pearson hypothesis testing framework.
As a versatile and influential measure, standard deviation has significantly impacted the field of statistics, proving invaluable for comprehending data distribution and making population inferences.