Probability and Statistics Index > SPSS Statistics > Crosstabs in SPSS
Crosstabs is just another name for contingency tables, which summarize the relationship between different categorical variables. Crosstabs in SPSS can help you visualize the proportion of cases in subgroups.
The basic crosstabs in SPSS command gives you counts by default (in other words, you’ll get a frequency distribution table with counts). In order for crosstabs to be useful and produce the information you normally see in a contingency table, you’ll need to specify row-percents or column-percents.
You may also be interested in this article, which uses crosstabs for a hypothesis test: How to Perform a Chi-Square Test in SPSS.
How to Use Crosstabs in SPSS: Steps
Watch the video for the steps:
Example question: Make an SPSS Crosstab for age (2, 3, 4, 6, 8, 44, 34, 33, 45, 56, 57, 57) vs. healthcare type (1, 1, 2, 3, 4, 5, 6, 1, 2, 4, 5, 5). Show percentages of healthcare type in the contingency table.
Step 1: Type your data into an SPSS worksheet. Contingency tables require at least two variables (columns) of data. For this example question, type ages into the first column and then type Healthcare into the second column. Change the variable names (the column headers) by clicking the “Variable” button at the bottom of the sheet and typing over the variable name.
Step 2: Click “Analyze,” then hover over “Descriptive Statistics” and then click “Crosstabs.” The Crosstabs dialog window will open.
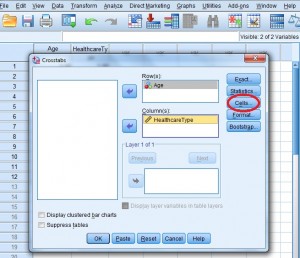
Step 3: Select one variable in the left window and then click the top arrow to populate the “Row(s)” box. Select a variable to populate the “Column(s)” box and then click the center arrow. For this sample problem, “Age” was selected for “Row(s)” and “Healthcare Type” was selected for “Column(s).” Once you have made your selection, click “Cells.”

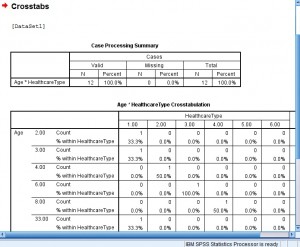
Step 4: Check which percentages you want to see (rows or columns). What you select will depend upon what variables you put in rows and what you put in columns. For this sample problem, “Healthcare Type” was placed in the columns, so check “Column” under percentages.
Step 5: Click “Continue” and then click “OK.” The Crosstabs window will appear.

Tip: Typically in a contingency table, the independent variable is placed in rows and the dependent variable is placed in columns. This is just a tradition and has no mathematical basis, so don’t over analyze which variable to place in columns and which to place in rows when you are creating crosstabs in SPSS.
Comments are closed.