Key Takeaways:
- Spearman Correlation in SPSS is an alternative to Pearson Correlation.
- Data must be ranked/ordinal.
- Results vary from no correlation (0) to perfect correlation (±1).
Spearman correlation is an alternative to Pearson correlation for ranked data or data measured on the ordinal scale. Note: If you are unfamiliar with how SPSS categorizes variables, see: SPSS Nomimal Ordinal Scale.
For this example, I’m using one of the SPSS sample datasets, which come with every download of SPSS 28. If you want to follow along with the example, first open the “breakfast” file. To find the file:
- Click File → Open → Data.
- Click C: → rRogram Files → IBM → SPSS Statistics → Samples.
- Select your language and then click the file name “breakfast”.
Spearman Correlation in SPSS: Steps
Watch the video for a guide on calculating Spearman Correlation in SPSS, or read on below.

Can’t see the video? Click here to watch it on YouTube.
For this example, I’m going to use the “breakfast” dataset to see if there is any correlation for preferences of English muffins and Jelly Donuts.
Step 1: Check to make sure your variables are ranked or measured on the ordinal scale. In the breakfast sample dataset, both of my variables are on the ordinal scale.
Step 2: Click Analyze → Correlate → Bivariate. This action opens the Bivariate correlation window.
Step 3: Move the variables of interest over to the Variables box. To do this, highlight each variable then click the blue arrow in the center.
Step 4: Uncheck the Pearson correlation check box and then place a check the Spearman correlation check box.
When you have completed the action, your window should look like this:
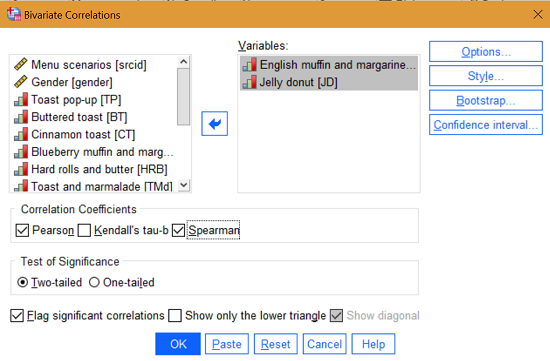
Step 5: Click OK.
Step 6: Read the results in the output viewer window (you may need to scroll down).
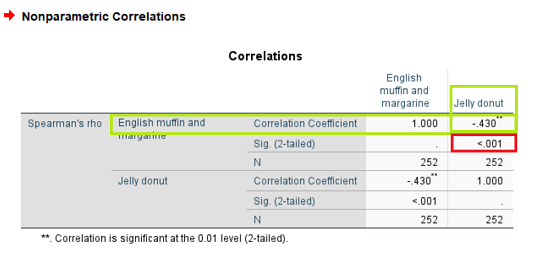
Note that the SPSS output viewer will give you correlations for all variables, including correlations of a variable (e.g., English muffin) with itself (this gives a perfect correlation of 1). But the result we are interested in here is the intersection of jelly donuts and English muffin (highlighted in green). This shows a moderate negative correlation of .430. The p-value (in red) is tiny (.001), indicating this is a statistically significant result.