Observed Variables: Definition
Contents
Definitions
- What is a Chi Square Test?
- What is a Chi-Square Statistic?
- Chi Square P-Values.
- The Chi-Square Distribution & Chi Distribution
Calculations:
See also:
What is a Chi Square Test?
Watch the video for an overview of the tests:

Can’t see the video? Click here to watch it on YouTube.
There are two types of chi-square tests. Both use the chi-square statistic and distribution for different purposes:
- A chi-square goodness of fit test determines if sample data matches a population. For more details on this type, see: Goodness of Fit Test.
- A chi-square test for independence compares two variables in a contingency table to see if they are related. In a more general sense, it tests to see whether distributions of categorical variables differ from each another.
What is a Chi-Square Statistic?
The formula for the chi-square statistic used in the chi square test is:
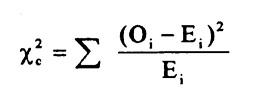
The subscript “c” is the degrees of freedom. “O” is your observed value and E is your expected value. It’s very rare that you’ll want to actually use this formula to find a critical chi-square value by hand. The summation symbol means that you’ll have to perform a calculation for every single data item in your data set. As you can probably imagine, the calculations can get very, very, lengthy and tedious. Instead, you’ll probably want to use technology:
A chi-square statistic is one way to show a relationship between two categorical variables. In statistics, there are two types of variables: numerical (countable) variables and non-numerical (categorical) variables. The chi-squared statistic is a single number that tells you how much difference exists between your observed counts and the counts you would expect if there were no relationship at all in the population.
There are a few variations on the chi-square statistic. Which one you use depends upon how you collected the data and which hypothesis is being tested. However, all of the variations use the same idea, which is that you are comparing your expected values with the values you actually collect. One of the most common forms can be used for contingency tables:
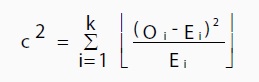
Where O is the observed value, E is the expected value and “i” is the “ith” position in the contingency table.
A low value for chi-square means there is a high correlation between your two sets of data. In theory, if your observed and expected values were equal (“no difference”) then chi-square would be zero — an event that is unlikely to happen in real life. Deciding whether a chi-square test statistic is large enough to indicate a statistically significant difference isn’t as easy it seems. It would be nice if we could say a chi-square test statistic >10 means a difference, but unfortunately that isn’t the case.
You could take your calculated chi-square value and compare it to a critical value from a chi-square table. If the chi-square value is more than the critical value, then there is a significant difference.
You could also use a p-value. First state the null hypothesis and the alternate hypothesis. Then generate a chi-square curve for your results along with a p-value (See: Calculate a chi-square p-value Excel). Small p-values (under 5%) usually indicate that a difference is significant (or “small enough”).
Tip: The Chi-square statistic can only be used on numbers. They can’t be used for percentages, proportions, means or similar statistical values. For example, if you have 10 percent of 200 people, you would need to convert that to a number (20) before you can run a test statistic.
Back to Top
Chi Square P-Values.
A chi square test will give you a p-value. The p-value will tell you if your test results are significant or not. In order to perform a chi square test and get the p-value, you need two pieces of information:
- Degrees of freedom. That’s just the number of categories minus 1.
- The alpha level(α). This is chosen by you, or the researcher. The usual alpha level is 0.05 (5%), but you could also have other levels like 0.01 or 0.10.
In elementary statistics or AP statistics, both the degrees of freedom(df) and the alpha level are usually given to you in a question. You don’t normally have to figure out what they are. You may have to figure out the df yourself, but it’s pretty simple: count the categories and subtract 1.
Degrees of freedom are placed as a subscript after the chi-square (Χ2) symbol. For example, the following chi square shows 6 df:
Χ26.
And this chi square shows 4 df:
Χ24.
Back to Top
The Chi-Square Distribution
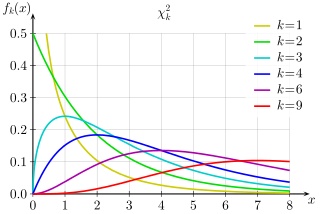
The chi-square distribution (also called the chi-squared distribution) is a special case of the gamma distribution; A chi square distribution with n degrees of freedom is equal to a gamma distribution with a = n / 2 and b = 0.5 (or β = 2).
Let’s say you have a random sample taken from a normal distribution. The chi square distribution is the distribution of the sum of these random samples squared . The degrees of freedom (k) are equal to the number of samples being summed. For example, if you have taken 10 samples from the normal distribution, then df = 10. The degrees of freedom in a chi square distribution is also its mean. In this example, the mean of this particular distribution will be 10. Chi square distributions are always right skewed. However, the greater the degrees of freedom, the more the chi square distribution looks like a normal distribution.
A chi-bar-squared distribution is a mixture of chi-square distributions, mixed over their degrees of freedom. You’ll often find them when testing a hypothesis with an inequality.
Uses
The chi-squared distribution has many uses in statistics, including:
- Confidence interval estimation for a population standard deviation of a normal distribution from a sample standard deviation [1].
- Independence of two criteria of classification of qualitative variables.
- Relationships between categorical variables (contingency tables).
- Sample variance study when the underlying distribution is normal.
- Tests of deviations of differences between expected and observed frequencies (one-way tables).
- The chi-square test (a goodness of fit test).
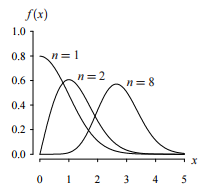
Chi Distribution
A similar distribution is the chi distribution [2]. This distribution describes the square root of a variable distributed according to a chi-square distribution.; with df = n > 0 degrees of freedom has a probability density function of:
f(x) = 2(1-n/2) x(n-1) e(-(x2)/2) / Γ(n/2)
For values where x is positive.
The cdf for this function does not have a closed form, but it can be approximated with a series of integrals, using calculus.
How to Calculate a Chi Square Statistic
Watch the video for an overview on how to calculate the chi-square statistic by hand:

Can’t see the video? Click here to watch it on YouTube.
The chi-square formula is a difficult formula to deal with. That’s mostly because you’re expected to add a large amount of numbers. The easiest way to solve the formula is by making a table.
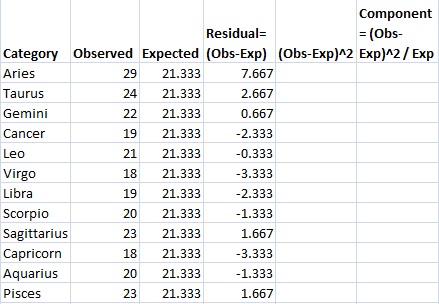
Example question: 256 visual artists were surveyed to find out their zodiac sign. The results were: Aries (29), Taurus (24), Gemini (22), Cancer (19), Leo (21), Virgo (18), Libra (19), Scorpio (20), Sagittarius (23), Capricorn (18), Aquarius (20), Pisces (23). Test the hypothesis that zodiac signs are evenly distributed across visual artists.
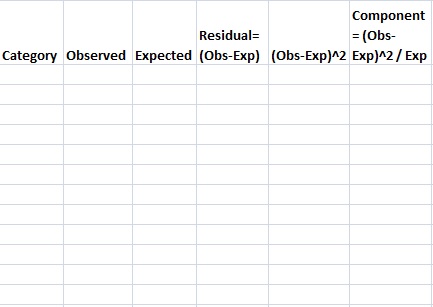
Step 1: Make a table with columns for “Categories,” “Observed,” “Expected,” “Residual (Obs-Exp)”, “(Obs-Exp)2” and “Component (Obs-Exp)2 / Exp.” Don’t worry what these mean right now; We’ll cover that in the following steps.
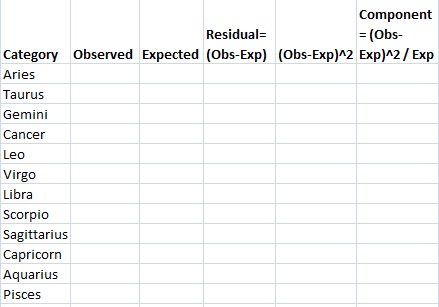
Step 2: Fill in your categories. Categories should be given to you in the question. There are 12 zodiac signs, so:
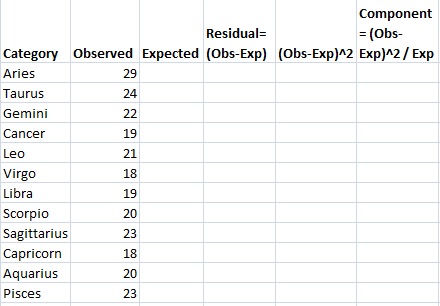
Step 3: Write your counts. Counts are the number of each items in each category in column 2. You’re given the counts in the question:
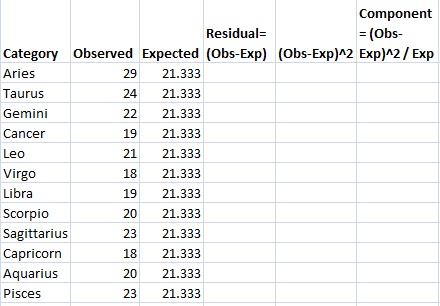
Step 4: Calculate your expected value for column 3. In this question, we would expect the 12 zodiac signs to be evenly distributed for all 256 people, so 256/12=21.333. Write this in column 3.
Step 5: Subtract the expected value (Step 4) from the Observed value (Step 3) and place the result in the “Residual” column. For example, the first row is Aries: 29-21.333=7.667.
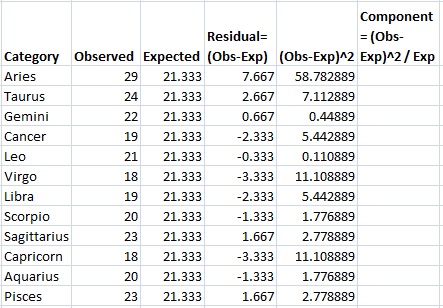
Step 6: Square your results from Step 5 and place the amounts in the (Obs-Exp)2 column.
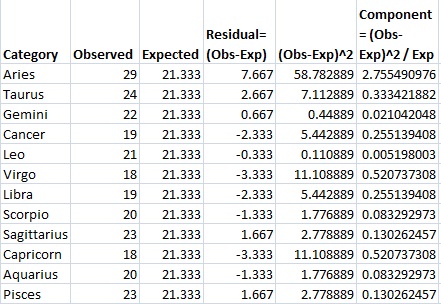
Step 7: Divide the amounts in Step 6 by the expected value (Step 4) and place those results in the final column.
Step 8: Add up (sum) all the values in the last column.
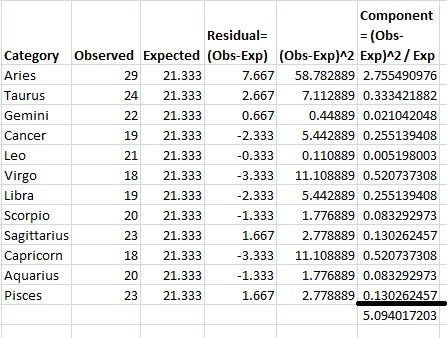
This is the chi-square statistic: 5.094.
SPSS Instructions.
You’ll find the chi square test in SPSS under “Crosstabs”.
Example problem: Run a chi square test in SPSS.
Note: In order to run a chi-square test in SPSS you should already have written a hypothesis statement. See: How to state the null hypothesis.
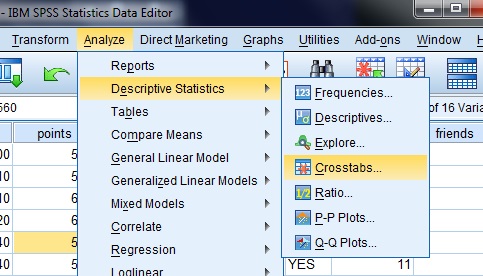
Step 1: Click “Analyze,” then click “Descriptive Statistics,” then click “Crosstabs.”
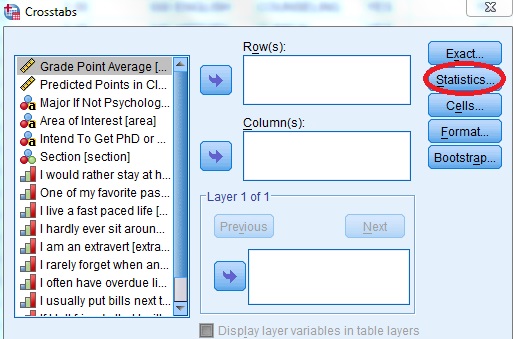
Step 2: Click the “Statistics” button. The statistics button is to the right of the Crosstabs window. A new pop up window will appear.
Step 3: Click “Chi Square” to place a check in the box and then click “Continue” to return to the Crosstabs window.
Step 4: Select the variables you want to run (in other words, choose two variables that you want to compare using the chi square test). Click one variable in the left window and then click the arrow at the top to move the variable into “Row(s).” Repeat to add a second variable to the “Column(s)” window.
Step 5: Click “cells” and then check “Rows” and “Columns”. Click “Continue.”
Step 6: Click “OK” to run the Chi Square Test. The Chi Square tests will be returned at the bottom of the output sheet in the “Chi Square Tests” box.
Step 7: Compare the p-value returned in the chi-square area (listed in the Asymp Sig column) to your chosen alpha level.
Check out our YouTube channel for more help with stats. Find dozens of videos on basic stats principles plus how to calculate stats using Microsoft Excel.
How To Test a Chi Square Hypothesis (Test for Independence)
Watch the video for how to test a hypothesis with chi-square using the p-value method:

Can’t see the video? Click here to watch it on YouTube.
A chi-square test for independence shows how categorical variables are related. There are a few variations on the statistic; which one you use depends upon how you collected the data. It also depends on how your hypothesis is worded. All of the variations use the same idea; you are comparing the values you expect to get (expected values) with the values you actually collect (observed values). One of the most common forms can be used in a contingency table.
The chi square hypothesis test is appropriate if you have:
- Discrete outcomes (categorical.)
- Dichotomous variables.
- Ordinal variables.
For example, you could have a clinical trial with blood sugar outcomes of hypoglycemic, normoglycemic, or hyperglycemic.
Test a Chi Square Hypothesis: Steps
Sample question: Test the chi-square hypothesis with the following characteristics:
- 11 Degrees of Freedom
- Chi square test statistic of 5.094
Note: Degrees of freedom equals the number of categories minus 1.
Step 1: Take the chi-square statistic. Find the p-value in the chi-square table. If you are unfamiliar with chi-square tables, the chi square table link also includes a short video on how to read the table. The closest value for df=11 and 5.094 is between .900 and .950.
Note: The chi square table doesn’t offer exact values for every single possibility. If you use a calculator, you can get an exact value. The exact p value is 0.9265.
Step 2: Use the p-value you found in Step 1. Decide whether to support or reject the null hypothesis. In general, small p-values (1% to 5%) would cause you to reject the null hypothesis. This very large p-value (92.65%) means that the null hypothesis should not be rejected.
Reference
[1] Johns Hopkins.
[2] Kenney, J. F. and Keeping, E. S. Mathematics of Statistics, Pt. 2, 2nd ed. Princeton, NJ: Van Nostrand, 1951.