How Do I get SPSS to Generate Descriptive Statistics?
SPSS has two primary options for calculating statistics: Descriptives (for basic statistics like mean, median, range and standard deviation) and Frequencies (additional options like Quartiles, Percentiles, and more dispersion statistics).
Descriptive Statistics SPSS: Descriptives Option
Step 1: Click Analyze, mouse over Descriptive Statistics, and then click Descriptives to open the Descriptives box.
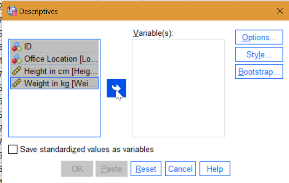
Step 2: Select the variables you want descriptive statistics in SPSS for. If you have multiple variables, you can select one at a time or hold down the Ctrl key and click to select all of your variables of interest. Click the blue arrow in the center to move the selected variables from the left to the right-hand Variables box.
Step 3: Click Options in the right-hand column of the Descriptives box. This action opens the Options window.
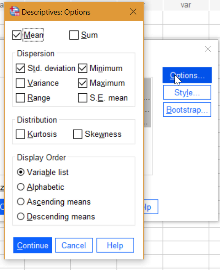
Place a check mark next to any additional descriptives you would like, or uncheck those that you don’t want.
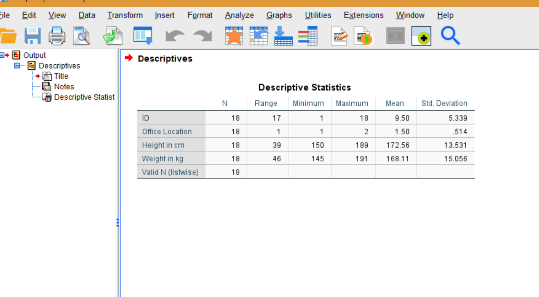
Step 3: Click Continue, then click OK. The descriptive statistics SPSS calculates will be displayed in the output window. Unlike many SPSS tests and features, a single box will appear with your chosen statistics; There is no need to scroll down.
Descriptive Statistics SPSS: Frequencies Option
Step 1: Click Analyze, then mouse over Descriptive Statistics, and then click Frequencies to open the Descriptives box.
Step 2: Move the Variables you want to analyze. Click the variables one at a time (or all together), then click the blue arrow to move them over to the Variables box.
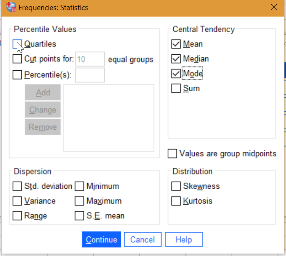
Step 3: Click Statistics in the right-hand column (the top blue button) to open the Frequencies: Statistics box.
Step 4: Click the box to check the statistics you would like. More options are available here, like Quartiles, which were not available in the Descriptives box in Part 1 above.
Step 5: Click Continue, then click OK. The Descriptive Statistics SPSS output window will display the requested results.