Post Hoc Tests > Benjamini-Hochberg Procedure
What is the Benjamini-Hochberg Procedure?
Watch the video or read on below.

Can’t see the video? Click here to view it on YouTube.
The Benjamini-Hochberg Procedure is a powerful tool that decreases the false discovery rate.
Adjusting the rate helps to control for the fact that sometimes small p-values (less than 5%) happen by chance, which could lead you to incorrectly reject the true null hypotheses. In other words, the B-H Procedure helps you to avoid Type I errors (false positives).
A p-value of 5% means that there’s only a 5% chance that you would get your observed result if the null hypothesis were true. In other words, if you get a p-value of 5%, it’s telling you that it’s unlikely the null hypothesis is true. But it’s only a probability–many times, true null hypotheses are thrown out just because of the randomness of results.
A concrete example: Let’s say you have a group of 100 patients who you know are free of a certain disease. Your null hypothesis is that the patients are free of disease and your alternate is that they do have the disease. If you ran 100 statistical tests at the 5% alpha level, roughly 5% of results would report as false positives.
This can be challenging to avoid: when you run statistical tests, a fraction will always be false positives. However, the B-H procedure does control the false discovery rate, which allows more power while limiting the proportion of false positives.
How to Run the Benjamini–Hochberg procedure
- Put the individual p-values in ascending order.
- Assign ranks to the p-values. For example, the smallest has a rank of 1, the second smallest has a rank of 2.
- Calculate each individual p-value’s Benjamini-Hochberg critical value, using the formula (i/m)Q, where:
- i = the individual p-value’s rank,
- m = total number of tests,
- Q = the false discovery rate (a percentage, chosen by you).
- Compare your original p-values to the critical B-H from Step 3; find the largest p value that is smaller than the critical value.
As an example, the following list of data shows a partial list of results from 25 tests with their p-values in column 2. The list of p-values was ordered (Step 1) and then ranked (Step 2) in column 3. Column 4 shows the calculation for the critical value with a false discovery rate of 25% (Step 3). For instance, column 4 for item 1 is calculated as (1/25) * .25 = 0.01:
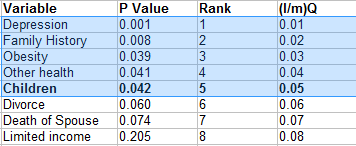
The bolded p-value (for Children) is the highest p-value that is also smaller than the critical value: .042 < .050. All values above it (i.e. those with lower p-values) are highlighted and considered significant, even if those p-values are higher than the critical values. For example, Obesity and Other Health are individually, not significant when you compare the result to the final column (e.g. .039 > .03). However, with the B-H correction, they are considered significant; in other words, you would reject the null hypothesis for those values.
References
Beyer, W. H. CRC Standard Mathematical Tables, 31st ed. Boca Raton, FL: CRC Press, pp. 536 and 571, 2002.
Agresti A. (1990) Categorical Data Analysis. John Wiley and Sons, New York.
Kotz, S.; et al., eds. (2006), Encyclopedia of Statistical Sciences, Wiley.
Vogt, W.P. (2005). Dictionary of Statistics & Methodology: A Nontechnical Guide for the Social Sciences. SAGE.