SPSS For Beginners > Fisher’s Exact Test in SPSS
Fisher’s Exact Test of Independence is used when you have two nominal variables in SPSS and want to find out if proportions for one variable are different among values of the second variable. For experiments with small numbers of participants (under around 1,000), Fisher’s is more accurate than the chi-square test. Here’s how to run a Fisher’s Exact Test in SPSS.
Fisher’s Exact Test in SPSS: Steps
I have a set of data here on outcomes for a final exam with students either taking in-class studies or online studies. They either pass or fail the class. In variable view, I have added values of 1 for in class and 2 for online. For my second variable, 1 is pass and 2 is fail, but you can code this in a different way if you like.
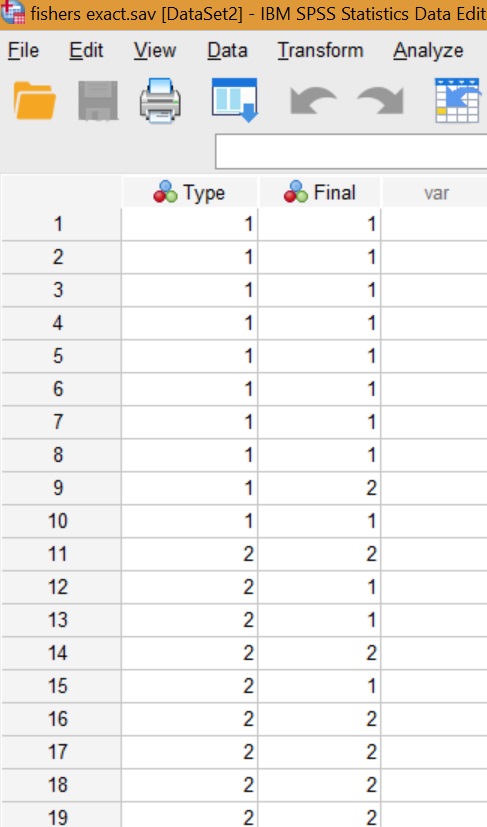
I want to know if the type of studying — online or in class — affects whether the students pass or fail the final test. All of my observations are independent; there are no matched pairs (for example, a student taking the test twice on different days). The null hypothesis is that the relative proportions of one ordinal variable are independent of the second variable.
Go to Analyze → Descriptive Statistics → Crosstabs
- Place the predictor variable in the Rows(s) box.
- Place the outcome (dependent) variable in the Columns(s) box.
- In Statistics, check “Chi-Square.” There isn’t an specific option for Fisher’s Exact test, but if you check this box SPSS will run the test as part of the process (assuming your data meets the criteria for the test). The test can handle more than two variables. If you have more than two variables, they must still be dichotomous. In other words, two values like 0 and 1 or 1 and 2.
- Click cells and then check Counts: Observed, Expected, and Percentages: Row, Columns, Total.
- Check “Display clustered bar charts”. This is an option if you like visualizations.
- Click OK.
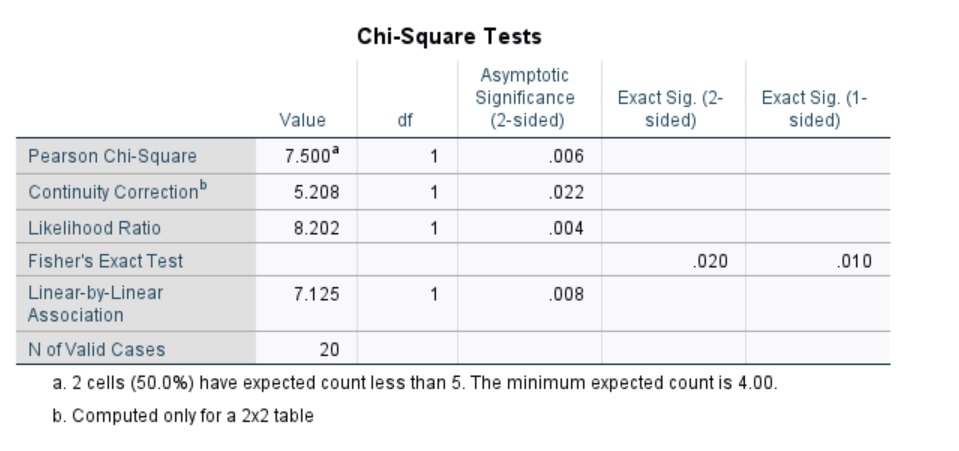
The Crosstabs gives us a lot of useful information, like the counts of passes and fails. It looks like in class has more of an effect than online. If we look below at the Chi Square Tests box, we can see that there’s a message: two cells have expected counts less than 5. In this case, we can read Fisher’s exact. The p-value is .02, which is significant at the default alpha level of 5%. We can reject the null hypothesis that the relative proportions of one variable are independent of the second. In other words, relative proportions of the type of study are not independent of the pass/fail outcome of the test. Note: If you do not see a Fisher’s Exact test result, go back and check your data entry to make sure you have dichotomous entries and that you haven’t mistyped an entry.
Lets say you run through Fisher’s exact test in SPSS a second time with a larger set of data. However, you look below the Chi Square Tests box and see the message: zero cells have expected counts less than 5. In this case, you have to read the Pearson Chi-Square and not Fisher’s exact.