Statistics Definitions > Contingency Table
Contingency Table: Overview
Contingency tables (also called crosstabs or two-way tables) summarize the relationship between several categorical variables. It is a special type of frequency distribution table, where two variables are shown simultaneously.
For example, a researcher might be investigating the relationship between AIDS and sexual preference. The two variables would be AIDS and SEXUAL PREFERENCE. If the question is “Is there a significant relationship between AIDS and sexual preference?”, then a chi-square test could then be run on the table to determine if there is a relationship between the two variables.
The following contingency table shows exposure to a potential source of foodborne illness (in this case, ice-cream). From the table, you can see that 13 people in a case study ate ice cream; 17 people did not:
In the above image, there’s an Odds Ratio calculation.
Chi-Square Tests
A chi2 test can be conducted on contingency tables to test whether or not a relationship exists between variables. These effects are defined as relationships between rows and columns. The chi2 test:
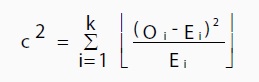
Where “O” is the Observed value, “E” is the expected value and “i” is the “ith” position in the table. The sigma (Σ) is the summation symbol. The following picture shows what your contingency table might look like with your data, plus the results from running a chi2 test on your data. A small chi2 value means that there is little relationship between the categorical variables. A large chi2 value means that there is a definite correlation between the two variables. As there is strong evidence that sexual orientation is linked to a higher risk of contracting AIDS, it’s no surprise that the chi2 value is high:
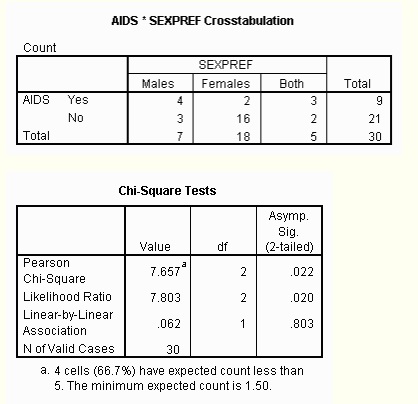
However, the note under the results states that “4 cells (66.7%) have expected count less than 5.” Generally, if this is over 25%, the result could be due to chance alone. Therefore, the results from this particular test are not statistically significant.
Contingency Table in Excel
Contingency tables are notoriously labor-intensive to produce and involve computing the expected frequency for each cell. The procedure is further complicated by the fact that you may have to make a correction for continuity if the expected cell frequency is below 5 (the correction for continuity for 2 x 2 tables is called the Yates correction). Many popular programs have the capability to make contingency tables, including Microsoft Excel (note that even in Excel, the process is quite complicated, involving the creation of pivot tables).
References
Agresti, A. An Introduction to Categorical Data Analysis (Wiley Series in Probability and Statistics) 3rd Edition, 2018.
Image credit: Missouri State University