The two major tests for normality in SPSS are the Shapiro-Wilk and KS Test. However, you can also check skewness, kurtosis, histograms, and QQ plots. All of this can be achieved with running a single analysis.
Watch the video to see how to run all of these tests for normality in SPSS with a few clicks:
There are many reasons for checking normality, but perhaps the most important is to check the assumption of normality for various hypothesis tests.
Tests for Normality in SPSS: Steps
Here’s how to run the tests:
- Click “Analyze”,
- Click “Descriptive Statistics”,
- Click “Explore”,
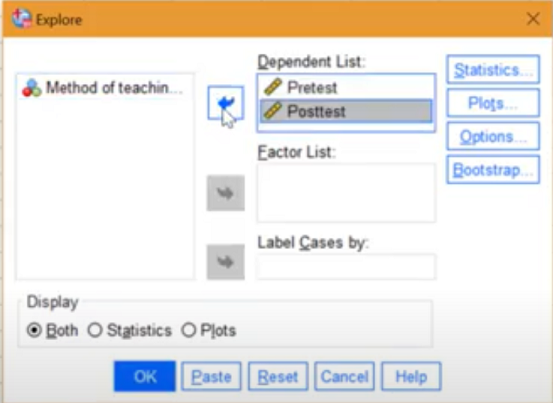
- Place your dependent variables (the ones you want to check for normality) into the Dependent List box.

Move the dependent variables over by clicking the center arrow. - Click “Statistics” at the top right of the Explore box, and check the Descriptives box.
- Click “Continue”.
- Click “Plots” at the top right of the Descriptives box.
- Check the Histogram and Normality Plots.
- Click “Continue”, then click “OK.”
The Output
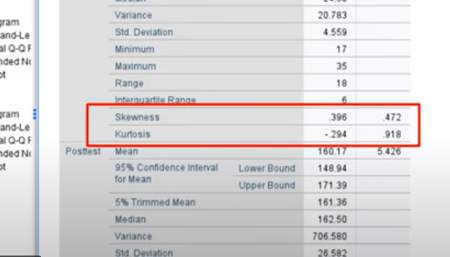
There’s a lot of information in the output. Some of it is informational (like skewness and kurtosis). Which information you look at depends on if you are interested in one of the formal tests or if you just want a general idea of what your data looks like.
For the formal tests (KS and Shapiro-Wilk), look for p-values greater than 5%. Assuming you ran the analysis with the default .05 alpha level, any values less than .05 would cause you to reject the null hypothesis that the data follows a normal distribution.
For less formal analysis, check the histogram and QQ plots to see if the data roughly follows a normal distribution. For the QQ plot, your data should be clustered close to the line.
Also, the skewness and kurtosis should be no greater than ±1, otherwise, your data is non normal.
