Statistics Definitions > Shapiro-Wilk Test
Contents:
What is the Shapiro-Wilk Test?
The Shapiro-Wilk test is a way to tell if a random sample comes from a normal distribution. The test gives you a W value; small values indicate your sample is not normally distributed (you can reject the null hypothesis that your population is normally distributed if your values are under a certain threshold). The formula for the W value is:
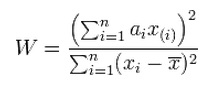
where:
- xi are the ordered random sample values
- ai are constants generated from the covariances, variances and means of the sample (size n) from a normally distributed sample.
The test has limitations, most importantly that the test has a bias by sample size. The larger the sample, the more likely you’ll get a statistically significant result.
It’s rare that you’ll want to calculate the Shapiro-Wilk by hand. Many software packages can make the calculations for you.
Shapiro Wilk in SPSS
Watch the video for a guide on calculating Shapiro Wilk in SPSS, or read on below.
Can’t see the video? Click here to watch it on YouTube.
-
- Go to Analyze → Descriptive Statistics → Explore
- Move the variables you want to test for normality from the left hand box to the right hand “Dependent List” box. You can either drag and drop or click the item in the left box and then click the center blue arrow to move the item.
- Click Options. This controls how missing values should be treated.
- Exclude cases listwise: exclude any cases with missing values for the selected variables.
- Exclude cases pairwise: Compute the mean for each variable using all non-missing responses for that particular variable.
- Report values: this option will only affect analysis for a factor variable.
Click Continue.
- (Optional). Click Plots. Uncheck Stem-and-leaf, then check histogram. Click Continue.
- Check Normality Plots with Tests.
- (Optional). Click Statistics, then check Outliers. Click Continue.
- click OK.
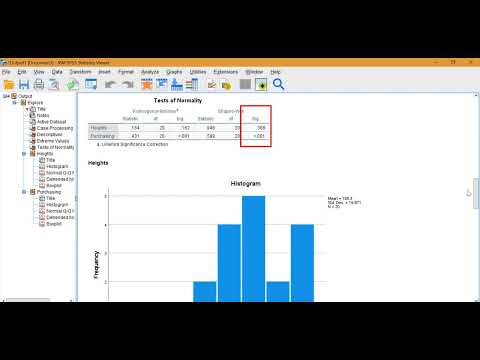
Results: If you have a small “Sig.” value in the “Tests of Normality” box, this indicates your data is not normally distributed. In other words, you would reject the null hypothesis that your data is normally distributed. SPSS gives you results for the K-S test at the same time. These may give you different results. You should read the K-S for large sample sizes (n ≥ 50) and the Shapiro-Wilk for small sample sizes (< 50).
How to Perform a Shapiro-Wilk Test in Other Software
- Minitab:
- Click BASIC STATISTICS
- Choose NORMALITY TEST
- Type your data column in the VARIABLE BOX (do not fill in the reference
box) - Choose RYAN JOINER (this is the same as Shapiro-Wilk)
- Click OK
- R: Although not as popular as SPSS or Excel, R does have the ability to perform the test. The argument is very simple:
> shapiro.test(sample)
You can find more information about the argument here. - Excel: This article has a very good outline of how to run the test in Excel for samples up to 5,000. There are also instructions on how to handle larger samples.
- SAS: The SAS support site has comprehensive instructions for a variety of Goodness of Fit tests. You can find the documentation here.
Tip: Use this test in combination with a normal probability plot.
References
Beyer, W. H. CRC Standard Mathematical Tables, 31st ed. Boca Raton, FL: CRC Press, pp. 536 and 571, 2002.
Everitt, B. S.; Skrondal, A. (2010), The Cambridge Dictionary of Statistics, Cambridge University Press.
Gonick, L. (1993). The Cartoon Guide to Statistics. HarperPerennial.
Vogt, W.P. (2005). Dictionary of Statistics & Methodology: A Nontechnical Guide for the Social Sciences. SAGE.