- Data entry for the Chi-Square Goodness of Fit Test SPSS.
- How to run the test using Legacy Dialogs.
- What to do if you have unequal expected values.
The chi-square goodness of fit test is used to test for statistical significance between observed and expected frequencies. In other words, we can test how well these two sets “fit.”
Chi-Square Goodness of Fit Test SPSS: Data Entry
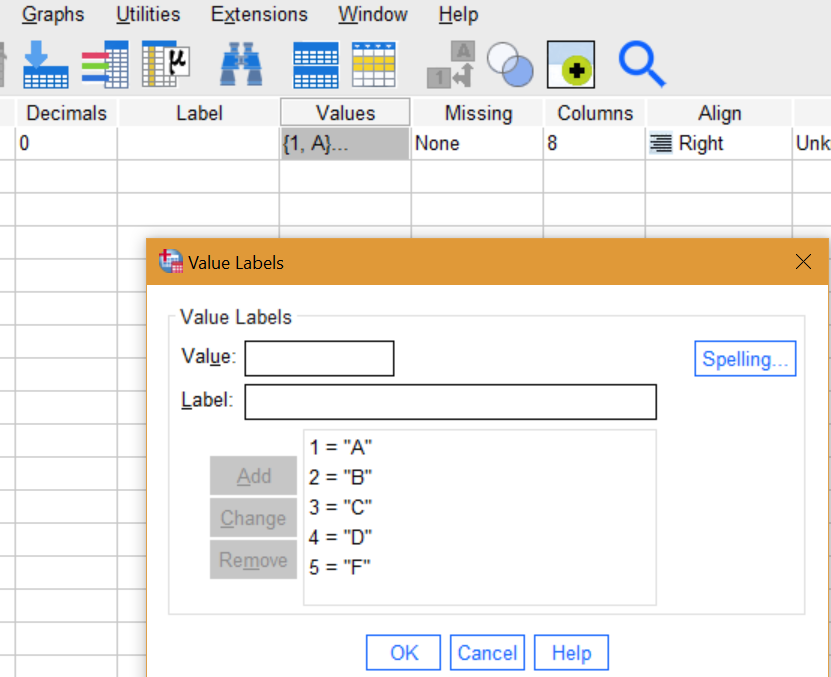
I entered a hypothetical set of grades into SPSS, with one nominal variable (Grades). You could also choose “ordinal.” The grades have value labels of A = 1, B = 2, C = 3, D = 4, and F = 5:
I expect that the grades are equally distributed. I have 40 data points, so I would expect to find 8 grades in the A group, 8 in the B group, and so on.
Running the Test
Step 1: Go to Analyze → nonparametric tests → Legacy Dialogs → Chi-Square. The following dialog box will open:
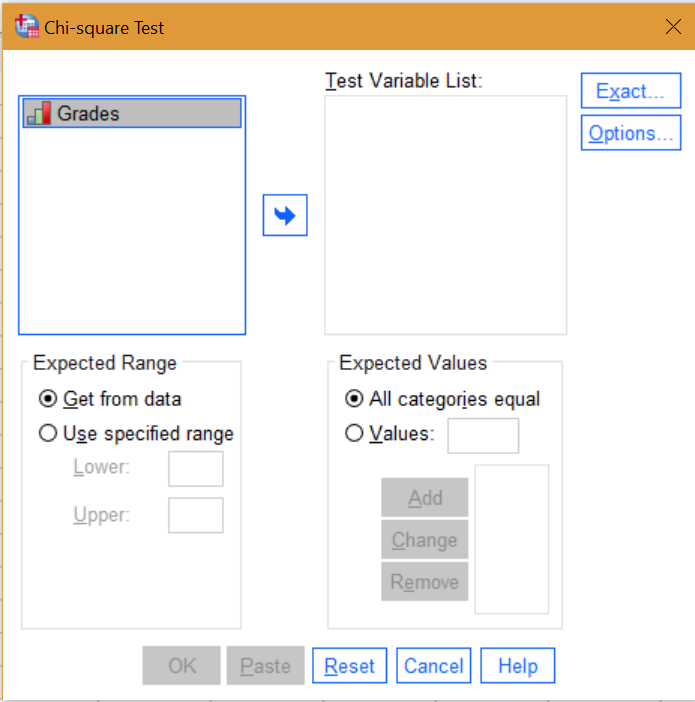
Step 2: Move the test variable (Grades) into the Test Variable List box by clicking “Grades” then the center blue arrow.
Step 3: Click the Options button on the right hand side, then click “Descriptives.”
Step 4: Click “Continue” then click “OK.” The output viewer window will open:
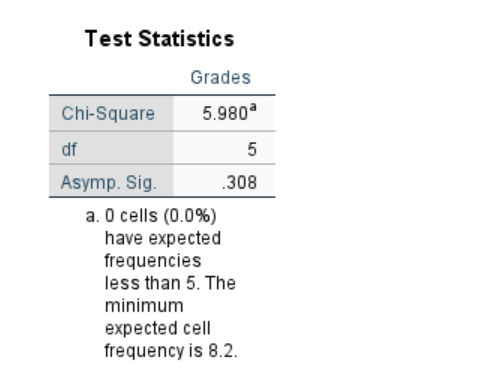
The significance (highlighted in red) of .308 is not significant. There isn’t a different between observed and expected frequencies (a p-value lower than .05 means that there is a difference between observed and expected frequencies).
What Do I Do For Unequal Expected Values?
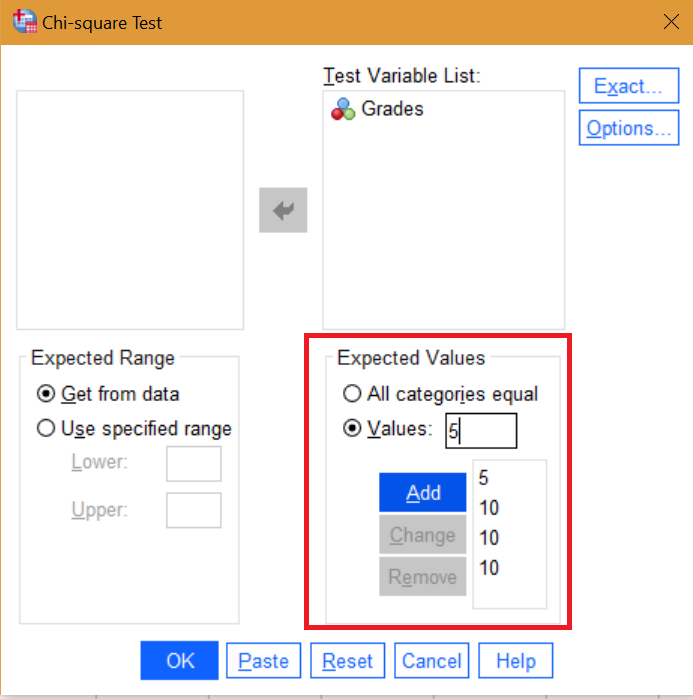
The default test that I ran above assumes the expected values. Let’s say that historically, you would expect the groups to be unequal as follows:
- A = 5
- B = 10
- C = 10
- D = 10
- F = 5
You can specify this by clicking the “Values” radio button in the Chi-Square Test dialog box (which you opened in Step 1 above) and entering the values in order. Type in a value then click the “Add” button after each entry:
Click “OK” to change the output viewer with the new values.