Statistics Definitions > Dispersion
Contents:
- What is Dispersion?
- What dispersion is used for
- Measures of Dispersion
- Example
- Absolute and relative measures
What is Dispersion?
Dispersion (also called scatter, spread, or variability) is a way of describing how spread out a set of data is. It refers to the degree to which data points are spread out from a central point such as the mean, and represents the variability within a dataset.
Put more simply, it is a measure of how much a data distribution is stretched or squeezed [1].
When a data set has a large dispersion, the values in the set are widely scattered; when it is small the items in the set are tightly clustered. For example, this set of data has a small dispersion value:
- 1, 2, 2, 3, 3, 4
…and this set has a wider one:
- 0, 1, 20, 30, 40, 100.
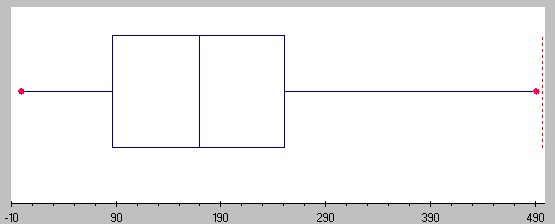
The spread of a data set can be described by a range of descriptive statistics including variance, standard deviation, and interquartile range. Spread can also be shown in graphs: dot plots, boxplots, and stem and leaf plots have a greater distance with samples that have a larger dispersion and vice versa.
What dispersion is used for
Dispersion serves as a valuable tool for understanding the way data is distributed. It allows for comparisons between different datasets, identification of outliers, and drawing inferences about the population from which the data originates. Dispersion, location and central tendency are the the most used properties of distributions.
Dispersion in statistics is a nonnegative real number representing the degree of variability in a dataset. This value is zero when all data points are identical and increases as the data becomes more varied. For instance, when comparing two datasets—one with high variance and another with low variance—you can conclude that the data with high variance is more widely spread than the data with low variance. This implies that the data points in the high-variance set are more likely to be further from the mean compared to those in the low-variance set.
Dispersion also aids in identifying outliers, which are data points significantly different from the rest of the dataset. By calculating the interquartile range and examining data points outside this range, outliers can be detected.
Lastly, dispersion helps infer characteristics about the population from which the data is derived. For example, if a dataset has a high variance, it’s reasonable to assume that the population is heterogeneous, consisting of various types of individuals.
Typically, dispersion measures share the same units as the quantities being assessed. For example, if the measurements are in meters or seconds, the dispersion measure will also be expressed in meters or seconds.
Measures of Dispersion
- Coefficient of dispersion: A “catch-all” term for a variety of formulas, including distance between quartiles.
- Standard deviation: probably the most common measure. It tells you how spread out numbers are from the mean,
- Index of Dispersion: a measure of dispersion commonly used with nominal variables.
- Interquartile range (IQR): describes where the bulk of the data lies (the “middle fifty” percent).
- Interdecile range: the difference between the first decile (10%) and the last decile (90%).
- Range : the difference between the smallest and largest number in a set of data.
- Mean difference or difference in means: measures the absolute difference between the mean value in two different groups in clinical trials.
- Median absolute deviation (MAD): the median of the absolute deviations from a data set’s median.
- Quartiles: Numbers that split the data into four quarters (first, second, third, and fourth quartiles).
In some processes, like manufacturing or measurement, low dispersion is associated with high precision. High dispersion is associated with low precision.
Example
Let’s say you were asked to compare measures of dispersion for two data sets.
- Data set A has the items 97,98,99,100,101,102,103.
- Data set B has items 70,80,90,100,110,120,130.
By looking at the data sets you might be able to deduce that the means and medians are the same (100). However, the range (which gives you an idea of how spread out the entire set of data is) is much larger for data set B (60) when compared to data set A (6). In fact, nearly all measures of dispersion would be ten times greater for data set B, which makes sense as the range is ten times larger. For example, take a look at the standard deviations for the two data sets:
- Standard deviation for A: 2.16 Standard deviation for B: 21.60.
The figure for data set B is ten times that of A.
Warning: When using a calculator (or a formula), check to make sure you are using the correct setting (or formula) for your data. Many measures of dispersion (like the variance) have two different formulas, one for a population and one for a sample.
Check out our statistics YouTube channel.
Absolute and relative measures of dispersion
Dispersion measures can be further classified as absolute or relative measures of dispersion. An absolute measure of dispersion is a statistical metric that quantifies the spread or variability of a dataset using the same units as the data itself. These measures provide an indication of how dispersed the data points are around a central value, such as the mean or median.
- Absolute measures of dispersion cannot be used to compare datasets with different units or scales, as the measures will be influenced by the unit of measurement. In such cases, relative measures of dispersion, like the coefficient of variation, should be used instead.
- A relative measure of dispersion quantifies the degree of spread within a dataset as a ratio or percentage of the mean. Since these measures are not influenced by the data’s scale, they can be used to compare the dispersion of two or more datasets with varying units.
| Absolute Measure of Dispersion | Relative Measure of Dispersion |
|---|---|
| Uses original units | Expressed as a ratio or percentage. |
| Not affected by the data’s scale. | Affected by the scale of the data. |
| Can be used to compare data with different units. | Cannot be used to compare data with different units. |
| More sensitive to outliers. | Is less sensitive to outliers. |
| Examples: range, standard deviation, quartile deviation. | Examples: coefficient of range, coefficient of variation, coefficient of standard deviation. |
References
- NIST/SEMATECH e-Handbook of Statistical Methods. “1.3.6.4. Location and Scale Parameters”. www.itl.nist.gov. U.S. Department of Commerce.