> Statistics Definitions > Population Mean
Contents:
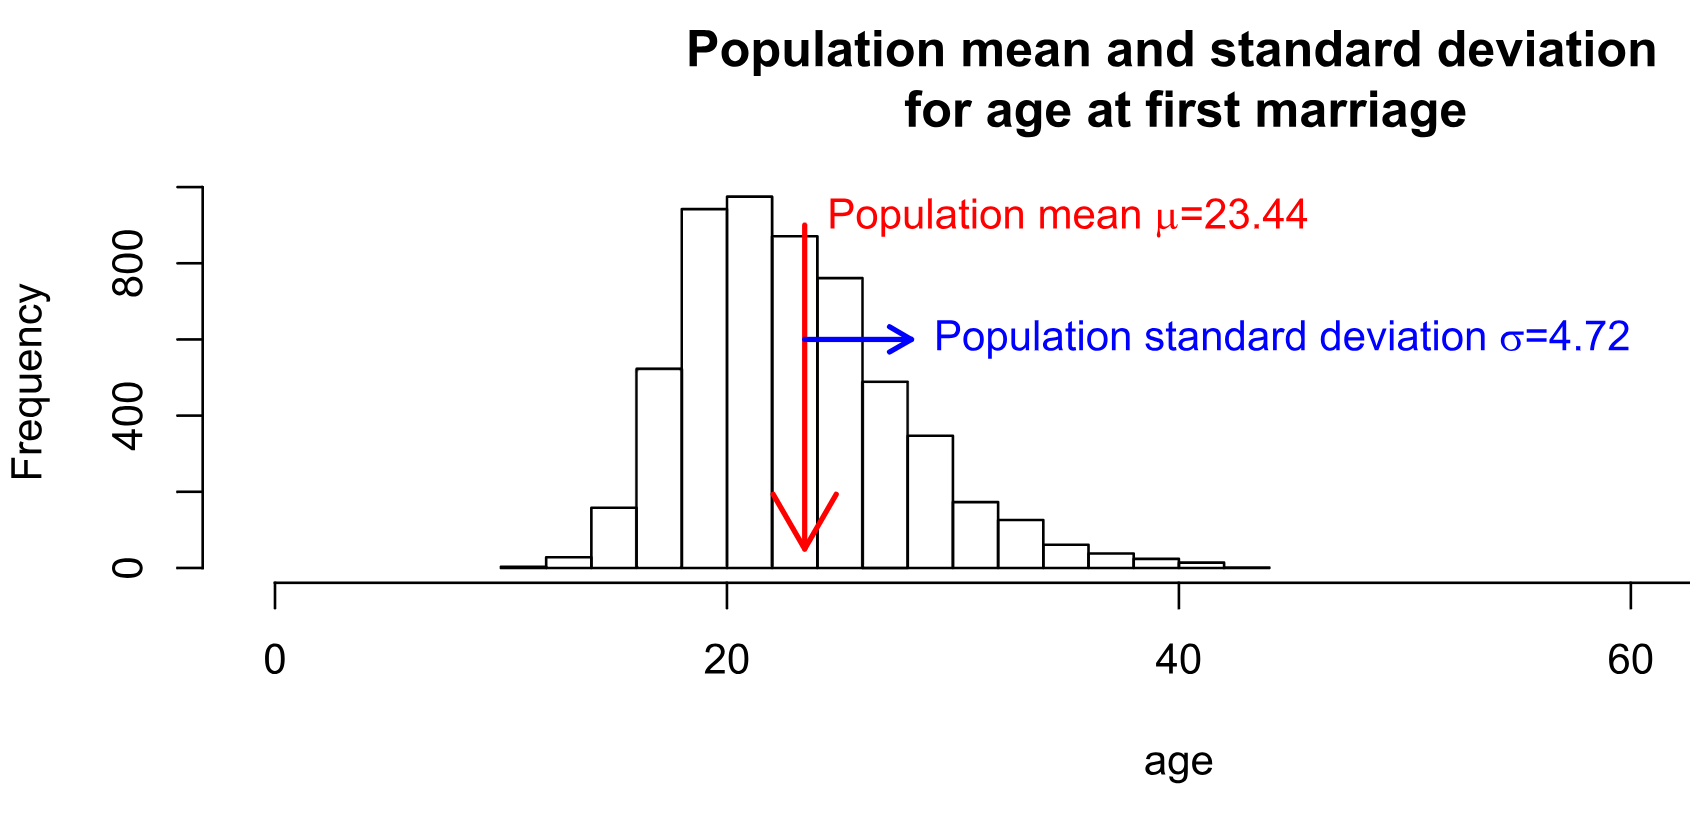
Graph showing population mean (μ) and standard deviation of age at first marriage [1].
What is the population mean?
The population mean represents the average of a characteristic within a specific group, which could include people, items, or things, such as “all individuals residing in the United States” or “all dog owners in Georgia.” A characteristic is anything that can be measured or counted. They can be used to describe data sets and to make inferences about populations. For example:
- The number of hours students spend studying per week.
- The average height of people in a country.
- The number of cars sold in a month.
- The average price of a house in a city.
- The number of people who voted in an election.
- The number of times library e-books are borrowed.
- The average weight of dogs that visit a veterinary clinic.
In statistics, calculating the population mean is often challenging because surveying an entire population can be expensive and time-consuming. For example, a veterinary clinic may maintain weight records for all pets that visit, allowing the calculation of the average weight of all dogs at that practice. However, if a pet food company wanted to know the average weight of a dog, it would be impossible to track down and weigh all of the millions of dogs in the US. Instead, a sample (a small portion of the dog population) would be weighed, and this figure would be used to estimate the population mean.
Formula and Example
The population mean symbol is the Greek letter mu (μ). The choice of using μ for the population mean is primarily a convention that has been followed historically and consistently in the field of statistics for hundreds of years [2]. This convention helps create a clear distinction between the population mean (μ) and the sample mean (x̄), making it easier for statisticians and researchers to communicate their findings effectively.
Finding the population mean is similar to the way you find an average:
- Add (sum) all the individual values X1, X2,…,XN. In summation notation, that’s ∑X.
- Divide that total by the number of values, NN.
The formula is:
μ = (Σ * X)/ N
where:
- Σ = the summation symbol (“the sum of”).
- X = all the individual items in the group.
- N = the number of items in the group.
Example question: All 57 residents in a nursing home were surveyed to see how many times a day they eat meals. 1 meal (2 people) 2 meals (7 people) 3 meals (28 people) 4 meals (12 people) 5 meals (8 people) What is the population mean for the number of meals eaten per day?
Solution:
- Sum up all of your X values. This is the Σ X portion of the population mean formula. 1 + 1 + 2 + 2 + 2 + 2 + 2 + 2 + 2 + 3 + 3 + 3 + 3 + 3 + 3 + 3 + 3 + 3 + 3 + 3 + 3 + 3 + 3 + 3 + 3 + 3 + 3 + 3 + 3 + 3 + 3 + 3 + 3 + 3 + 3 + 3 + 3 + 4 + 4 + 4 + 4 + 4 + 4 + 4 + 4 + 4 + 4 + 4 + 4 5 + 5 + 5 + 5 + 5 + 5 + 5 + 5 = 188. Note: You could also sum this with the following formula: (1*2)+(2*7)+(3*28)+(4*12)+(5*8)=188.
- Divide your answer to Step 1 with the number of items in your data set. There are 57 people, so: 188 / 57 = 3.29824561404.
That’s an average of 3.3 meals per person, per day. The population mean is 3.3.
Sample mean vs. population mean
It is important to differentiate between the population mean and the sample mean. Calculating the mean for a population (the entire group) requires different notation than calculating the mean for a sample (a portion of the group). The symbols for the two are distinct: Population mean symbol = μ Sample mean symbol = x̄.
| Characteristic | Population Mean | Sample Mean |
|---|---|---|
| Definition | Average value of all the observations in a population | Average value of a subset of observations taken from a population |
| Symbol | μ | x̄ |
| Estimation | Can be estimated from a sample. | Can be calculated directly from sample data. |
| Accuracy | More accurate than the sample mean. | Less accurate than the population mean. |
| Variance | Less variable than the sample mean | More variable than the population mean |
Watch the video for an example of how to find the sample mean:
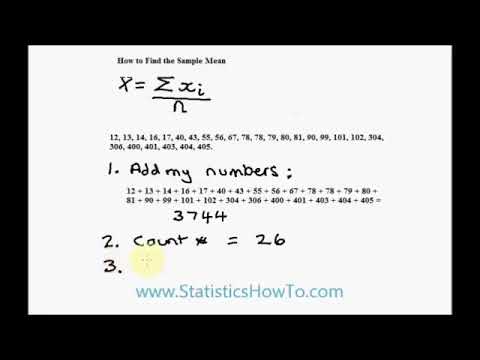
Can’t see the video? Click here to watch it on YouTube.
Next: Difference Between a Statistic and a Parameter
References
- Michaelg2015, CC BY-SA 4.0, via Wikimedia Commons
- Hald, A. A history of parametric statistical inference from Bernoulli to Fisher, 1713 to 1935.