Correlation Coefficients >
Tetrachoric Correlation
What is Tetrachoric Correlation?
Tetrachoric correlation is used to measure rater agreement for binary data; Binary data is data with two possible answers—usually right or wrong. The tetrachoric correlation estimates what the correlation would be if measured on a continuous scale. It is used for a variety of reasons including analysis of scores in Item Response Theory (IRT) and converting comorbity statistics to correlation coefficients. This type of correlation has the advantage that it’s not affected by the number of rating levels, or the marginal proportions for rating levels.
The term “tetrachoric correlation” comes from the tetrachoric series, a numerical method used before the advent of computers. While it’s more common to estimate correlations with methods like maximum likelihood estimation, there is a basic formula you can use.
Formula and Example

The formula involves the cosine trigonometric function and can be applied to a 2×2 matrix or contingency table:
rtet = cos (180/(1 + √(BC/AD)).
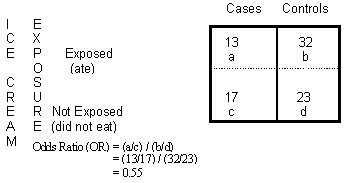
For the contingency table shown, note the placement of a/b/c/d in the table. Using those values and plugging them into the formula, we get:
- rtet = cos (180/(1 + √(32*17/13*23))
- rtet = cos (180/(1 + 1.34885))
- rtet = cos (180/(2.34885))
- rtet = cos (76.63324)
- rtet = 0.23.
.23 is a low correlation.
Assumptions for the Test
The two main assumptions are:
- The underlying variables come from a normal distribution. With only two variables, this is impossible to test. You should, therefore, have a good theoretical reason for using this particular type of correlation; in other words, you might know that the type of data you are dealing with tends to follow a normal distribution most of the time. Rating errors should also follow a normal distribution.
- There is a latent continuous scale underneath your binary data. In other words, the trait you are measuring should be continuous and not discrete.
In addition, you may want to make sure that errors are independent between raters and cases and the variance for errors is homogeneous across levels of the independent variable.
What the Correlation Means
The tetrachoric correlation coefficient rtet (sometimes written as r* or rt) tells you how strong (or weak) the association is between ratings for two raters. A “0” indicates no agreement and a “1” represents a perfect agreement. Most correlations will fall somewhere in between; what constitutes an acceptable level of agreement largely depends on what type of data you’re dealing with. For example, medical ratings between medical professionals will require a higher level of agreement than most non-medical situations. In general, an agreement over about .7 is usually considered “strong enough.”
References
Andrews University. More Correlation Coefficients. Retrieved 7-13-2016 from: http://ow.ly/5GLJ50wqTVC
Kotz, S.; et al., eds. (2006), Encyclopedia of Statistical Sciences, Wiley.