Statistics Definitions > Levene Test
Contents:
What is the Levene Test?
Levene’s test is used to check that variances are equal for all samples when your data comes from a non normal distribution. You can use Levene’s test to check the assumption of equal variances before running a test like One-Way ANOVA.
If you’re fairly certain your data comes from a normal or nearly normal distribution, use Bartlett’s Test instead.
The null hypothesis for Levene’s is that the variances are equal across all samples. In more formal terms, that’s written as:
H0: σ12 = σ22 = … = σk2.
The alternate hypothesis (the one you’re testing), is that the variances are not equal for at least one pair:
H0: σ12 ≠ σ22 ≠… ≠ σk2.
The test statistic is a little ugly and involves a few summations:
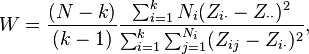
Zi,j can take on three meanings, depending on if you use the mean, median, or trimmed mean of any subgroup. The three choices actually determine the robustness and power of the test.
- Robustness, is a measure of how well the test does not falsely report unequal variances (when the variances are actually equal).
- Power is a measure of how well the test correctly reports unequal variances.
According to Brown and Forsythe:
- Trimmed means work best with heavy-tailed distributions like the Cauchy distribution.
- For skewed distributions, or if you aren’t sure about the underlying shape of the distribution, the median may be your best choice.
- For symmetric and moderately tailed distributions, use the mean.
Levene’s test is built into most statistical software. For example, the Independent Samples T Test in SPSS generates a “Levene’s Test for Equality of Variances” column as part of the output. The result from the test is reported as a p-value, which you can compare to your alpha level for the test. If the p-value is larger than the alpha level, then you can say that the null hypothesis stands — that the variances are equal; if the p-value is smaller than the alpha level, then the implication is that the variances are unequal.
Run a Levene’s Test for Equality of Variances in SPSS
Levene’s Test tests whether variances of two samples are approximately equal. Ideally, you want a non significant result for this test — that means your variances meet the assumption of equal variances. SPSS will automatically run a Levene’s test any time you run an independent samples t-test, but you can run a test independently using the following steps.
Note: The following steps are run on a set of data with two levels of the independent variable: At Home and In Office. The test scores are measured at the scale level.
Step 1 :Go to Analyze > General Linear Model → Univariate
Step 2 :Move your independent variable over to the Fixed Factor box.
Step 3 :Move your dependent variable over to the Dependent Variable box.
Step 4 :Click “Options”, then place a check mark next to Homogeneity Tests. At the bottom, you can change your alpha level, if desired. It’s common to set the alpha level at .01 or .001, especially with large sample sizes. This is because you’re more likely to get a statistically significant result for larger samples.
Step 6 :Click Continue, then click OK to run the test.
Reading the Output
Read the result from the Sig column (Based on Mean) in the Levene’s Test of Equality of Error Variances box. A non-significant result here (greater than .05) indicates you have met the assumption of homogeneity of variance (i.e., equal variances are assumed). A significant result here (lessthan .05) indicates you have violated the assumption of homogeneity of variance (i.e., equal variances are not assumed).
If you are reading the output as part of a t-test, this tells you whether you should interpret the t-test for equal variances assumed, or not assumed.
Reference:
Brown, M. B. and Forsythe, Robust Tests for the Equality of Variances. A. B. (1974), Journal of the American Statistical Association, 69, pp. 364-367. Available here.