- Z Scores allow you to compare data that’s measured with different units,
- SPSS can easily convert scale variables to z-scores,
- Step by step example of how to get z scores in SPSS.
A z score is a variable standardized to have a standard deviation of 1 and a mean of 0. Converting your data to z scores in SPSS allows you to compare sets of variables taken with different measurement systems. For example, if you have a set of height data measured in centimeters and volume measured in cubic centimeters, standardizing the data will make it easier for you to compare them.
Z Scores in SPSS: Steps
Watch the video for a guide on creating z scores in SPSS, or read on below.
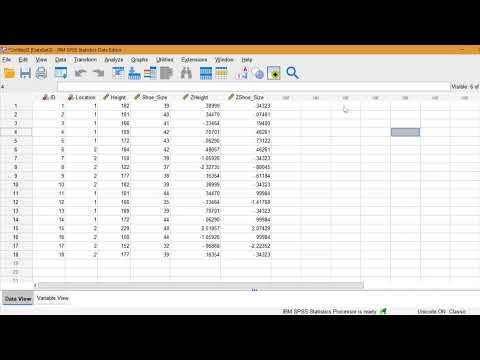
Can’t see the video? Click here to watch it on YouTube.
For this example, I want to compare height (measured in cm) and shoe size (measured in Paris points). I’m using SPSS 28, but these steps should work for most versions of SPSS released in the last decade. Older versions might need slight modifications to the steps (usually a different button or menu choice).
Step 1: Enter your data into SPSS. Both of the variables should be scale variables.
Step 2: Click Analyze → Descriptive Statistics → Descriptives. This opens the Descriptives box.
Step 3: Move the variables you want SPSS to calculate z scores for. To do this, click each item then click the blue arrow in the center.
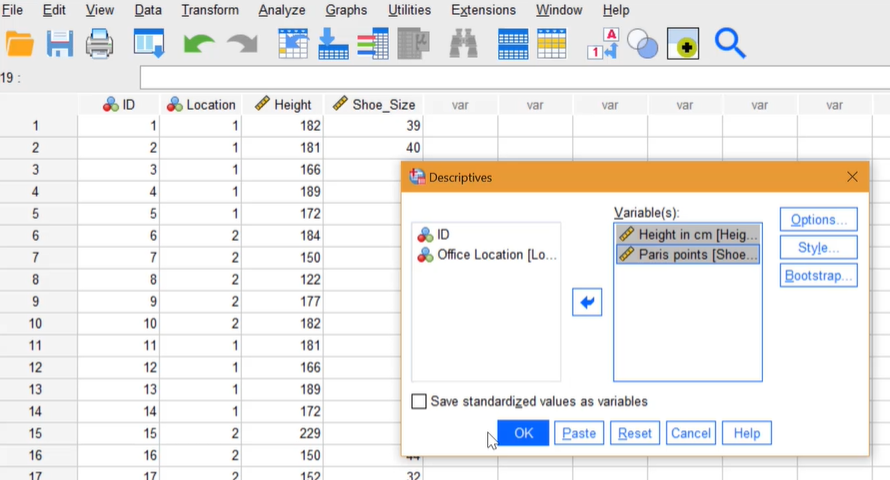
Step 4: Select the “Save standardized values as variables” check box, then click “OK.” The output viewer window will open with a few descriptive statistics.
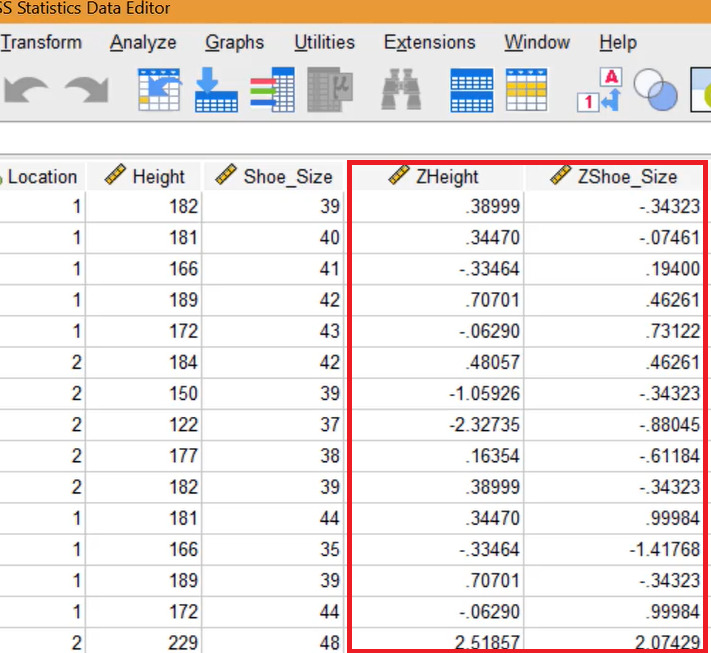
Step 5: Minimize or close the output viewer window to see the z scores in SPSS. When you return to the Dat View tab, you’ll see new columns with the variables you selected in Step 3. For this example, that’s height and shoe size; These have now been converted to z-scores: