How to run a MANCOVA in SPSS
Multivariate Analysis of Covariance (MANCOVA) is similar to an ANCOVA, except there are one or more covariates in the model. The model has many assumptions to test for (and therefore, many steps!). I’ve outlined the general steps below.
The video shows an example for a dataset of participants, and we want to know the relationship between ages (the independent variable) and two dependent variables:
- The number of hours worked,
- Income level.
We want to control for a covariate—years of education—which varies between 11 and 18 years.
Assumptions for MANCOVA
MANCOVA has several assumptions, which need to be checked before running the test. The data should be checked to make sure there are no missing values. In addition:
- The data should have no outliers.
- The data must be approximately normally distributed.
- There must be a linear relationship between the dependent variables and covariate(s).
- Data must also meet the homogeneity of variance-covariance assumption and homogeneity of regression slopes.
To check for outliers (1) and normality (2), create histograms, normal probability plots, and stem-and-leaf plots. In addition, you’ll want to run formal tests for normality:
- Go to Analyze→Descriptive Statistics→Explore.
- Move your two dependent variables and the covariate over to the Dependent List box.
- Click Statistics, then check the Descriptives and Outliers boxes.
- Click Continue, then click Plots.
- Check the Histograms box and the Normality Plots with Tests.
- Click Continue, then Click OK.
Check to make sure you do not have statistical significance in the “Tests for Normality” box. This will confirm your data is normal; Histograms give a visual of the result. The stem and leaf plots will identify any outliers.
For linearity (3), go to Graphs (in the output viewer)→Legacy Dialogs→Scatter Dot→Matrix Scatter. Click Define, move all three scale variables over, then click OK. You’re looking for a rough “ellipse” shape.
For homogeneity (4), run a custom MANCOVA. This is to test assumptions—it is not the final MANCOVA you’ll run to test your research hypothesis.
- click Analyze, General Linear Model, Multivariate.
- Move your dependent variables to “Dependent Variables”.
- Move your independent variable to “Fixed Factor”.
- Move your covariate to “Covariate.”
- Click EM Means. Move the independent variable over to the Display Means for box.
- Click Options. Check Homogeneity Tests, Descriptive Statistics, Estimates of Effect Size.
- Click Continue.
- Click Plots. Move the Independent variable over to the Horizontal Axis box. Click Add, then Continue.
- Click Model, Custom.
- Move your factor, covariate and factor*covariate over to Model.
- Click Continue, then OK.
In the output viewer, look at Box’s test. If Box’s significance level > .001, it is non-significant: use Wilk’s Lambda. Otherwise, use Pillai’s Trace. Interpret the results from either of those tests: if you get a significant finding, the assumption is violated and you cannot continue with the test.
How to Run A MANCOVA in SPSS
Finally, after meeting all of the above assumptions, we can run the test. As we have already done a lot of the preliminary work in testing the assumptions, running the test is fairly fast:
- Click Analyze → General Linear Model—Multivariate.
- Click Model. Change from Custom to Full Factorial.
- Click Continue, then click OK.
Check the output for significance. The example below shows that there is overall significant result for Wilks’ Lambda:
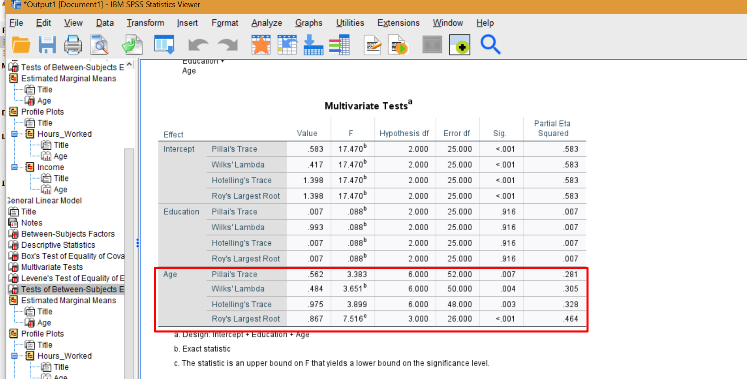
We can continue looking for individual significance in the output:
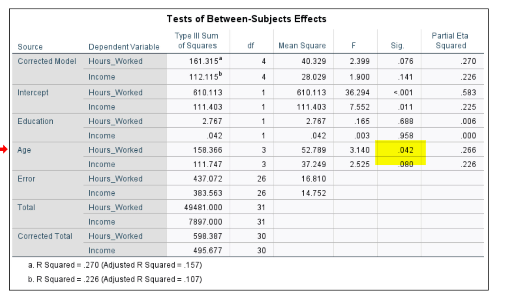
As we have a small p-value for age and hours worked, we can conclude there is an effect for those variables.