Contents (click to go to that section):
- About
- List of Types
- Different Sampling Methods: How to Tell the Difference
- What is Sampling Error?
- More Articles
About Samples
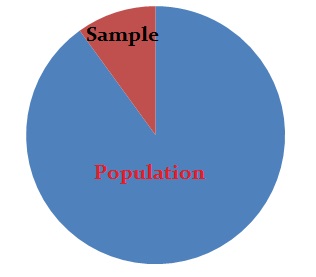
Samples are parts of a population. For example, you might have a list of information on 100 people (your “sample”) out of 10,000 people (the “population”). You can use that list to make some assumptions about the entire population’s behavior.
However, it’s not that simple. When you do stats, your sample size has to be ideal—not too large or too small. Then once you’ve decided on a sample size, you must use a sound technique to collect the sample from the population:
- Probability Sampling uses randomization to select sample members. You know the probability of each potential member’s inclusion in the sample. For example, 1/100. However, it isn’t necessary for the odds to be equal. Some members might have a 1/100 chance of being chosen, others might have 1/50.
- Non-probability sampling uses non-random techniques (i.e. the judgment of the researcher). You can’t calculate the odds of any particular item, person or thing being included in your sample.
Types:
Common Types
The most common techniques you’ll likely meet in elementary statistics or AP statistics include taking a sample with and without replacement. Specific techniques include:
- Bernoulli samples have independent Bernoulli trials on population elements. The trials decide whether the element becomes part of the sample. All population elements have an equal chance of being included in each choice of a single sample. The sample sizes in Bernoulli samples follow a binomial distribution. Poisson samples (less common): An independent Bernoulli trial decides if each population element makes it to the sample.
- Cluster samples divide the population into groups (clusters). Then a random sample is chosen from the clusters. It’s used when researchers don’t know the individuals in a population but do know the population subsets or groups.
- In systematic sampling, you select sample elements from an ordered frame. A sampling frame is just a list of participants that you want to get a sample from. For example, in the equal-probability method, choose an element from a list and then choose every kth element using the equation k = N\n. Small “n” denotes the sample size and capital “N” equals the size of the population.
- SRS : Select items completely randomly, so that each element has the same probability of being chosen as any other element. Each subset of elements has the same probability of being chosen as any other subset of k elements.
- In stratified sampling, sample each subpopulation independently. First, divide the population into homogeneous (very similar) subgroups before getting the sample. Each population member only belongs to one group. Then apply simple random or a systematic method within each group to choose the sample. Stratified Randomization: a sub-type of stratified used in clinical trials. First, divide patients into strata, then randomize with permuted block randomization.
Less Common Types
You’ll rarely (if ever) come across these techniques in a basic stats class. However, you’ll come across them in the “real world”:
- Acceptance-Rejection Sampling: A way to sample from an unknown distribution using a similar, more convenient distribution.
- Accidental sampling (also known as grab, convenience or opportunity sampling): Draw a sample from a convenient, readily available population. It doesn’t give a representative sample for the population but can be useful for pilot testing.
- Adaptive sampling (also called response-adaptive designs): adapt your selection criteria as the experiment progresses, based on preliminary results as they come in.
- Bootstrap Sample: Select a smaller sample from a larger sample with Bootstrapping. Bootstrapping is a type of resampling where you draw large numbers of smaller samples of the same size, with replacement, from a single original sample.
- The Demon algorithm (physics) samples members of a microcanonical ensemble (used to represent the possible states of a mechanical system which has an exactly specified total energy) with a given energy. The “demon” represents a degree of freedom in the system which stores and provides energy.
- Critical Case Samples: With this method, you carefully choose cases to maximize the information you can get from a handful of samples.
- Discrepant case sampling: you choose cases that appear to contradict your findings.
- Distance sample : a widely used technique that estimates the density or abundance of animal populations.
- The experience sampling method samples experiences (rather than individuals or members). In this method, study participants stop at certain times and make notes of their experiences as they experience them.
- Haphazard Sampling: where a researcher chooses items haphazardly, trying to simulate randomness. However, the result may not be random at all — tainted by selection bias.
Additional Uncommon Types
You’ll probably not come across these in a basic stats class.
- Inverse Sample: based on negative binomial sampling. Take samples until a specified number of successes have happened.
- Importance Sampling: a method to model rare events.
- The Kish grid: a way to select members of a household for interviews and uses a random number tables for the selections.
- Latin hypercube: used to construct computer experiments. It generates samples of plausible collections of values for parameters in a multidimensional distribution.
- In line-intercept sampling, a method where you include an element in a sample from a particular region if a certain line segment intersects the element.
- Use Maximum Variation Samples when you want to include extremes (like rich/poor or young/old). A related technique: extreme case sampling.
- Multistage sampling; one of a variety of cluster sampling techniques where you choose random elements from a cluster (instead of every member in the cluster).
- Quota sampling: a way to select survey participants. It’s similar to statified sampling but researchers choose members of a group based on judgment. For example, people closest to the researcher might be chosen for ease of access.
- Reservoir sampling: used in data mining to obtain a sample of size n from a data stream of unknown length.
- Respondent Driven Sampling. A chain-referral sampling method where participants recommend other people they know.
- A sequential sample doesn’t have a set size; take items one (or a few) at a time until you have enough for your research. It’s commonly used in ecology.
- Snowball samples: where existing study participants recruit future study participants from people they know.
- Square root biased sample: a way to choose people for additional screenings at airports. A combination of SRS and profiling.
Different Sampling Methods: How to Tell the Difference
You’ll come across many terms in statistics that define different sampling methods: simple random sampling, systematic sampling, stratified random sampling and cluster sampling. How to tell the difference between the different sampling methods can be a challenge. To learn more watch the video below or keep reading.

Different Sampling Methods: How to Tell the Difference: Steps
Step 1: Find out if the study sampled from individuals (for example, picked from a pool of people). You’ll find simple random sampling in a school lottery, where individual names are picked out of a hat. But a more “systematic” way of choosing people can be found in “systematic sampling,” where every nth individual is chosen from a population. For example, every 100th customer at a certain store might receive a “doorbuster” gift.
Step 2: Find out if the study picked groups of participants. For large numbers of people (like the number of potential draftees in the Vietnam war), it’s much simpler to pick people by groups (simple random sampling). In the case of the draft, draftees were chosen by birth date, “simplifying” the procedure.
Step 3: Determine if your study contained data from more than one carefully defined group (“strata” or “cluster”). Some examples of strata could be: Democrats and Republics, Renters and Homeowners, Country Folk vs. City Dwellers, Jacksonville Jaguars fans and San Francisco 49ers fans. If there are two or more very distinct, clear groups, you have a stratified sample or a “cluster sample.”
- If you have data about the individuals in the groups, that’s a stratified sample. In order to perform stratified sampling on this sample, you could perform random sampling of each strata independently.
- If you only have data about the groups themselves (you may only know the location of the individuals), then that’s a cluster sample.
Step 4: Find out if the sample was easy to get. Convenience samples are like convenience stores: why go out of your way to get samples, when you can nip out to the corner store? A classic example of convenience sampling is standing at a shopping mall, asking passers by for their opinion.
What is Sampling Error?
Errors happen when you take a sample from the population rather than using the entire population. In other words, it’s the difference between the statistic you measure and the parameter you would find if you took a census of the entire population.
If you were to survey the entire population (like the US Census), there would be no error. It’s nearly impossible to calculate the error margin. However, when you take samples at random, you estimate the error and call it the margin of error.

For example, if you wanted to figure out how many people out of a thousand were under 18, and you came up with the figure 19.357%. If the actual percentage equals 19.300%, the difference (19.357 – 19.300) of 0.57 or 3% = the margin of error. If you continued to take samples of 1,000 people, you’d probably get slightly different statistics, 19.1%, 18.9%, 19.5% etc, but they would all be around the same figure. This is one of the reasons that you’ll often see sample sizes of 1,000 or 1,500 in surveys: they produce a very acceptable margin of error of about 3%.
Formula: the formula for the margin of error is 1/√n, where n is the size of the sample. For example, a random sample of 1,000 has about a 1/√n; = 3.2% error.
Sample error can only be reduced, this is because it is considered to be an acceptable tradeoff to avoid measuring the entire population. In general, the larger the sample, the smaller the margin of error. There is a notable exception: if you use cluster sampling, this may increase the error because of the similarities between cluster members. A carefully designed experiment or survey can also reduce error.
Another Type of Error
The non-sampling error could be one reason as to why there’s a difference between the sample and the population. This is due to poor data collection methods (like faulty instruments or inaccurate data recording), selection bias, non response bias (where individuals don’t want to or can’t respond to a survey), or other mistakes in collecting the data. Increasing the sample size will not reduce these errors. They key is to avoid making the errors in the first place with a well-planned design for the survey or experiment.
More Articles
- Area sampling and area frames.
- What is the Large Enough Sample Condition?
- What is a Sample?
- How to Find a Sample Size in Statistics.
- What is the 10% Condition?
- What is Direct Sampling?
- Double sampling.
- What is Efficiency?
- Latin Hypercube Sampling.
- What is an Effective Sample Size?
- Finite Population Correction Factor.
- What is Markov Chain Monte Carlo?
- Oversampling in Statistics
- Resampling techniques.
- What is a Typical Case?
- How to Use Slovin’s Formula.
- Sample Distributions.
- What is the Samp. Distribution of the Sample Proportion?
- Sampling Design
- Sampling Unit
- What is Sampling variability?
- Total Population Sampling
- Undersampling
Check out our YouTube channel for more stats tips and help!
References
Everitt, B. S.; Skrondal, A. (2010), The Cambridge Dictionary of Statistics, Cambridge University Press.
Klein, G. (2013). The Cartoon Introduction to Statistics. Hill & Wamg.
Kotz, S.; et al., eds. (2006), Encyclopedia of Statistical Sciences, Wiley.
Vogt, W.P. (2005). Dictionary of Statistics & Methodology: A Nontechnical Guide for the Social Sciences. SAGE.
Undersampling
Undersampling attempts to reduce the bias(error) associated with imbalanced classes of data. In machine learning, undersampling and oversampling are two techniques that deal with imbalances in a training set (the part of data used to fit a model). You can undersample the majority class, oversample the minority class, or combine the two techniques.
In general, undersampling (instead of oversampling) the majority class works best for large data sets. That’s because with oversampling, you’re adding more data points, which can lead to a data set that’s too massive to use classifiers like support vector machines [1].
Random Undersampling
With random undersampling, you randomly remove members of the majority class until you reach a preset threshold.
One advantage to random selection here is that you don’t have to make decisions on which points are important and which are not: you simply let the random process do the work. Several studies have shown that random selection performs as well as, if not better than, processes where deliberate removal choices are made.
However, a distinct disadvantage is that the process could remove important members. Problems tend to result in data that is non-smooth, has boundaries or small features [2]. One way to avoid this pitfall is to combine undersampling and boosting (Liu et al., as cited in [1]). You might also want to manually resample or repair any holes in the data algorithmically.
References
[1] García-Pedrajas, N. et al. (2010). Trends in Applied Intelligent Systems: 23rd International Conference on Industrial Engineering and Other Applications of Applied Intelligent Systems, IEA/AIE 2010, Cordoba, Spain, June 1-4, 2010, Proceedings. Springer Science & Business Media.
[2] Dey, T. Undersampling and Oversampling in Sample Based Shape Modeling. Retrieved December 16, 2019 from: https://graphics.stanford.edu/courses/cs468-03-fall/Papers/deygiesen_undersampling.pdf