Effect Size > Omega Squared
Contents:
What is Omega Squared?
Omega squared (ω2) is a measure of effect size, or the degree of association for a population. It is an estimate of how much variance in the response variables are accounted for by the explanatory variables. Omega squared is widely viewed as a lesser biased alternative to eta-squared, especially when sample sizes are small.
Formula
For between-subjects, fixed effects designs, the formula is:
ω2 = (SSeffect – (dfeffect)(MSerror)) / MSerror + SStotal
These values are obtained from ANOVA output. This formula cannot be used for repeated measures designs.
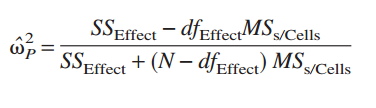
For multi-factor, completely randomized design, Keppel (1991) recommends the partial omega squared (or alternatively, the partial eta-squared). The partial ω2 formula is:
Interpreting Results
- ω2 can have values between ± 1.
- Zero indicates no effect.
- If the observed F is less than one, ω2 will be negative.
Caution should be used when interpreting results if your design includes a blocking factor. Omega squared can be misleading, as it tends to over-inflate the design effect (Cohen). This means that you shouldn’t use ω2 to compare designs that have blocking with those that do not. As the main purpose of effect sizes is to enable you to compare a series of studies, this can be a major problem.
If you manipulate all of the factors in your experimental design and your design includes two or more explanatory variables, partial ω2 is a good choice for measuring effect size. However, if your design includes any measured factors, you should not use partial ω2 as the results are often untrustworthy (Olejnik & Algina).
Omega Squared in SPSS
SPSS doesn’t have an option for calculating omega squared. But you can run an ANOVA, then take your results and use Excel to work the formula.
Step 1: Click Analyze → General Linear Model → Univariate.
Step 2: Choose your dependent variable in the left hand column and move it to the Dependent Variable box (use the center blue arrow to move the item).
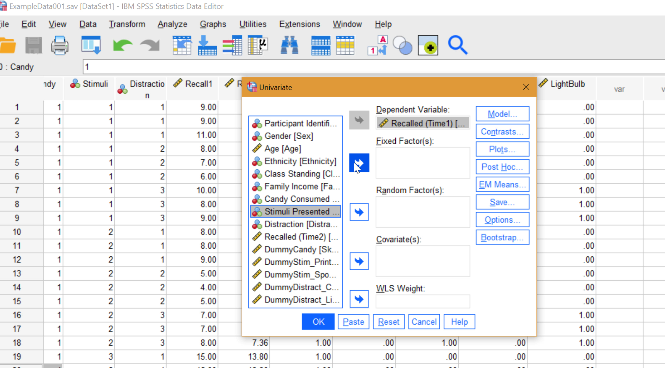
Step 3: Choose your independent variable in the left hand column and move it to the Fixed Factor box (use the center blue arrow to move the item).
Step 4: Click “Options” then place a check in the “Estimates of Effect Size” box. Click Continue, then OK.
Step 5: Copy the data into Excel. Right click on the chart, “copy special”, then “Plain text.”
Step 6: Use the results to place into the Omega squared formula. In the video at the top of the page, I show you how to do this in Excel, but you can use any calculator. SPSS labels things a little differently from those in the formula. The main difference is that the SS Treatments in the formula is the Sum of Squares Between (Independent Variable) in the SPSS output.
References:
Cohen, J. (1973). Eta-squared and partial eta-squared in fixed factor ANOVA designs. Educational and Psychological Measurement, 33, 107–112.
Keppel, G. (1991). Design and analysis: A researcher’s handbook. Englewood Cliffs, NJ: Prentice Hall.
Olejnik S and Algina J (2003). Generalized Eta and Omega Squared Statistics: Measures of effect size for some common research designs. Psychological Methods 8(4) 434-447. Retrieved October 11, 2016 from: here.