
When you first start a statistics class, you’ll be presented with the basics. Some of the terms, like bar graphs and line graphs, you’ll probably be familiar with from grade school math classes. Other terms, (like interquartile range) might be new to you. This site has a comprehensive range of articles covering statistics basics. Most of the articles have videos attached (you can always check out our YouTube channel for the complete list of hundreds of videos).
Basic Statistics Articles
Need help with a homework question? Check out our tutoring page!
- Interquartile Range: How to Find it.
- Discrete Variable vs Continuous Variables.
- How to Find a Range.
- How to Detect Fake Statistics.
- How to Find a Five Number Summary.
- How to Tell the Difference Between Different Sampling Methods.
- How to Find the Sample Standard Deviation.
- How to Find the coefficient of variation.
- How to Find Outliers.
- How to Classify a Variable as Quantitative or Qualitative.
- How to Find the Pooled Sample Standard Error.
- How to Tell the Difference Between a Statistic and a Parameter.
- How to Find the Sample Mean.
- Types of Variables
- AP Statistics Formulas.
- What is the Center of a Distribution?
- How to find the sample variance.
- Regression to the Mean.
- How to Calculate Expected Value
- Significant Digits and Rounding in Statistics.
- How to find the mean mode and median.
Statistics Basics: Charts and Graphs
- How to Make a Histogram.
- How to make a Relative Frequency Histogram.
- How to Make a Frequency Chart and Determine Frequency.
- How to Choose Bin Sizes in Statistics.
- How to Read a Box Plot.
- How to Find a Box Plot Interquartile Range.
- How to Draw a Frequency Distribution Table.
- How to Make a Cumulative Frequency Distribution Table.
- How to Make a Stemplot.
Excel
- How to Find the Mode in Excel 2013.
- How to Find the Mean in Excel.
- How to Find the Standard Deviation in Excel.
- How to Find an Interquartile Range in Excel.
- How to Find a 5 Number Summary in Excel.
Statistics Basics: Definitions
- What is an Average?
- What is an Absolute Value?
- What is Bias in Statistics?
- What are Categorical Variables?
- What is a Census?
- What is a Continuous Variable?
- What is a Dependent Event?
- What is a Discrete Variable?
- What is Elementary Statistics?
- What are Outliers?
- What is a Parameter?
- What are Quantitative Variables?
- What is Sample Variance?
- What is Standard Deviation?
- Statistics Symbols.
- What is a Statistic?
Pre-Statisitcs:
Statistics Basics: Overview
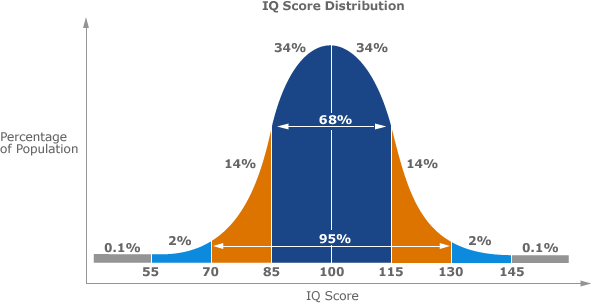
The most common basic statistics terms you’ll come across are the mean, mode and median. These are all what are known as “Measures of Central Tendency.” Also important in this early chapter of statistics is the shape of a distribution. This tells us something about how data is spread out around the mean or median. Perhaps the most common distribution you’ll see is the normal distribution, sometimes called a bell curve. Heights, weights, and many other things found in nature tend to be shaped like this:
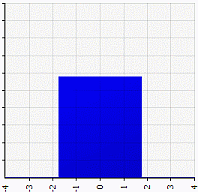
On the other end of the scale, you can also get a flat distribution. With this shape, the odds of anything happening are equal. For example, a uniform distribution can represent choosing a particular card from a standard deck; all the cards have a 1/52 chance of being chosen. Or tossing a coin, where you have a 50% chance of tossing a heads or a tails.
Basic statistics lays the foundation for further studies in statistics. It includes lots of ways to classify and sort variables and data so that they can be studied with tools you’ll be introduced to later. For example, correlation and hypothesis testing. Perhaps surprisingly, calculus-based statistics is often combined with basic statistics courses. Whether you need calculus with statistics depends largely on what your career goals are. For example, if you intend on becoming a university researcher, you’ll need calculus; If you’re a nursing student, calculus is optional.
References
Brase, C. & Brase, P. (2018). Understanding Basic Statistics. Cengage Learning.