Probability and Statistics Index > SPSS Statistics > How to Make an SPSS Frequency Table
SPSS is a popular statistical software package commonly used for the social sciences. A frequency distribution table can give you an idea about the spread of your data in a glance. Frequencies form the foundation of further study in statistics, like probabilities and distribution tables; They take seconds to create in SPSS once you have entered your data into a worksheet. SPSS uses the Frequency command to populate frequency tables.
How to Make an SPSS Frequency Table: Steps:
Example problem: You are studying people in a group home and want to look at their ages at a glance. Create an SPSS frequency table for the following ages: 2, 3, 4, 6, 8, 44, 34, 33, 45, 56, 57, 56.
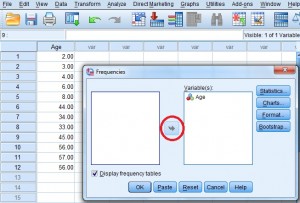
Step 1: Type your data into an SPSS worksheet. If you haven’t already done so, click “File,” then click “New,” then click “Data.” You may need to check the “Type in data” radio button. Make sure you enter your data into columns.
Step 2: Click “Analyze,” then mouse over “Descriptive Statistics” and then click “Frequencies.”
Step 3: Select one or more variables in the left column of the “Frequencies” pop up window and then click the center arrow to move them to the right hand “Variable(s)” window.

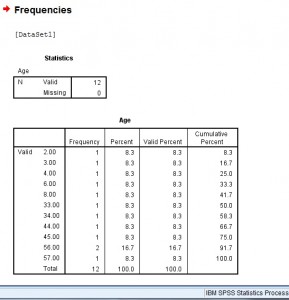
Step 4: Click the “Display Frequency Tables” check box and then click “OK.” SPSS will calculate the frequency table and display the results in a separate window. Included are frequencies, cumulative frequencies and percents.

Tip: “Variables” in SPSS are very similar to Column Headings in Microsoft Excel. SPSS will automatically name variables for you with something generic (like VAR0001). To change the variable name to something more meaningful (like “Age,”) click the “Variable View” button at the bottom of the worksheet. Type over the variable name and then return to data view by clicking the “Data View” button at the bottom of the sheet.