Effect Size > Hedges’ g
What is Hedges’ g?
Watch the video, or read on below.

Can’t see the video? Click here to watch it on YouTube.
Hedges’ g is a measure of effect size. Effect size tells you how much one group differs from another—usually a difference between an experimental group and control group.
Hedges’ g and Cohen’s d are extremely similar. Cohen’s d has an upwards bias (inflation) in results of up to about 4% for small samples. The two statistics are very similar except when sample sizes are below 20, when Hedges’ g outperforms Cohen’s d. Hedges’ g is therefore sometimes called the corrected effect size.
- For very small sample sizes (<20) choose Hedges’ g over Cohen’s d. The main difference between Hedges’ g and Cohen’s d is that Hedges’ g applies a small-sample correction factor to Cohen’s d. Hedges’ g (like Cohen’s d) can still show slight upward bias in very small samples, but substantially less than Cohen’s d.
- For sample sizes >20, the results for both statistics are roughly equivalent.
- If standard deviations are significantly different between groups, choose Glass’s delta instead. Glass’s delta uses only the control group’s standard deviation (SDC).
Formula
The Hedge’s g formula is:
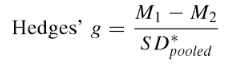
Where:
- M1 – M2 = difference in means.
- SD*pooled = pooled and weighted standard deviation.
A note on small sample sizes:
Hedges’ g (like Cohen’s d) is biased upwards for small samples (under 50). To correct for this, use the following formula, which is is a version of the bias-correction factor (often called J) applied to Cohen’s d:
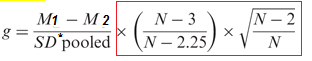
Practical interpretation for the formula:
- It corrects the upward bias of Cohen’s d in small samples.
- It is appropriate for small to moderate sample sizes (including < 50).
- As N increases, the correction → 1, so g ≈ d.
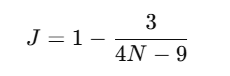
There are several mathematically equivalent approximations in the literature. The most common textbook version is
Interpreting Results
A g of 1 indicates the two groups differ by 1 standard deviation, a g of 2 indicates they differ by 2 standard deviations, and so on. Standard deviations are equivalent to z-scores (1 standard deviation = 1 z-score).
Rule of Thumb Interpretation
Cohen’s d and Hedges’ g are interpreted in a similar way. Cohen suggested using the following rule of thumb for interpreting results:
- Small effect (cannot be discerned by the naked eye) = 0.2
- Medium Effect = 0.5
- Large Effect (can be seen by the naked eye) = 0.8
“Naked eye” means that you could notice the difference between the two groups just by looking at the data (or a graph) without doing statistics.
So in effect-size terms:
- d ≈ 0.2 (small): Groups look almost the same; heavy overlap.
- d ≈ 0.5 (medium): Difference noticeable but overlapping.
- d ≈ 0.8 (large): Groups look clearly separated.
Cohen did suggest caution when using this rule of thumb. The terms “small” and “large” effects can mean different things in different areas. For example, a “small” reduction in suicide rates is invaluable, where a “small” weight loss may be meaningless. Durlak (2009) suggests referring to prior studies to see of where your results fit into the bigger picture.
References:
Cohen, J. (1977). Statistical power analysis for the behavioral sciences. Routledge.
Durlak, J. (2009) How to Select, Calculate, and Interpret Effect Sizes. Journal of Pediatric Psychology. March: 34(9):917-28.
Ellis, P. (2010). The Essential Guide to Effect Sizes: Statistical Power, Meta-Analysis, and the Interpretation of Research Results.
Hedges, L. (1981). Distribution Theory for Glass’s Estimator of Effect Size and Related Estimators. Journal of Educational Statistics. Vol. 6, No. 2 (Summer, 1981), pp. 107-128. Entire PDF available for free from JSTOR.
Hedges L. V., Olkin I. (1985). Statistical methods for meta-analysis. San Diego, CA: Academic Press