Skewed Distribution Contents:
- What is a Skewed Distribution?
- What is an Asymmetric Distribution?
- Skewed Left
- Skewed Right
- Log Transformations and Statistical Tests
- Skew normal distribution
What is a Skewed Distribution?
Watch the video or read the article below:
Can’t see the video? Click here to watch it on YouTube.
A skewed distribution has one tail that is longer than the other. Skewed distributions have more extreme values on one side and are sometimes called asymmetrical distributions as they don’t show any symmetry. However, there is a subtle difference:
- An asymmetrical distribution is any distribution that lacks symmetry around the mean.
- A skewed distribution is a specific type of asymmetric distribution with a long tail that “pulls” the mean away from the center.
For example, the chi-squared distribution is skewed and asymmetrical [1]:
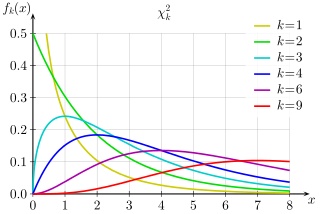
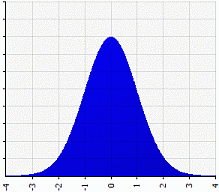
In comparison, the normal distribution is a symmetric distribution with no skew. The tails are exactly the same.
Negative and positive skew
The location of the long tail defines the skew of a distribution:
- A negative skewed distribution has a long tail on the negative direction of a number line. It’s also sometimes called a left-skewed distribution because its long tail is on the left. In these distributions, probabilities grow slowly then taper off quickly. Thus, it is a distribution with only a few extremely large values.
- A positive skewed distribution has a long tail on the positive direction on a number line. It’s also sometimes called a right-skewed distribution because it has a long right tail. In these distributions, the probabilities grow quickly and taper off slowly for high values. I has only a few extremely small values.
 Many probability distributions are skewed, including:
- A value of 0 means that the distribution is symmetric.
- A value greater than 0 means that the distribution is positively skewed.
- A value less than 0 means that the distribution is negatively skewed.
References
- By Geek3 (Own work) [GFDL
- Eberl, A. & Bernhard, K. Centre-free kurtosis orderings for asymmetric distributions. Retrieved July 13, 2023 from: https://publikationen.bibliothek.kit.edu/1000156220
- By Ruediger85 (changed language). Original by RobSeb (Own work) CC-BY-SA-3.0 , via Wikimedia Commons.
- GABAIX, X., GOPIKRISHNAN, P., PLEROU, V. & STANLEY, H. (2006). Institutional investors and stock market volatility. The Quarterly Journal of Economics 121, 461–504.
- Image: skbkekas|Wikimedia Commons. CC-BY-SA-3.0
- Journal of Statistics Education. Retrieved April 16, 2021 from: http://www.amstat.org/publications/jse/v13n2/vonhippel.html
- Beta distribution: can be skewed either left or right, depending on the values of its parameters.
- Cauchy distribution: skewed right.
- Exponential distribution: skewed left.
- Gamma: skewed left.
- Log-normal: skewed right.
- Student’s T-distribution: skewed right.
- Weibull: skewed left.
Real life example of a skewed distribution
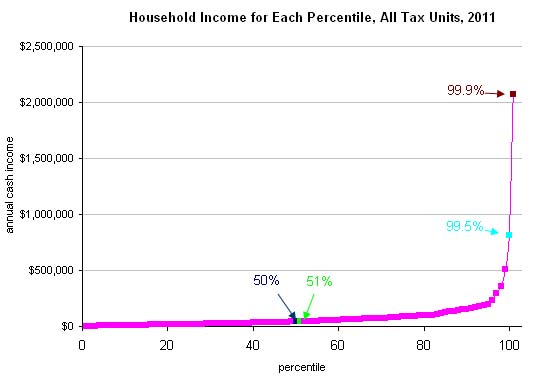
The normal distribution is the most common distribution you’ll come across. Next, you’ll see a fair amount of negatively skewed distributions. For example, household income in the U.S. is negatively skewed with a very long left tail.
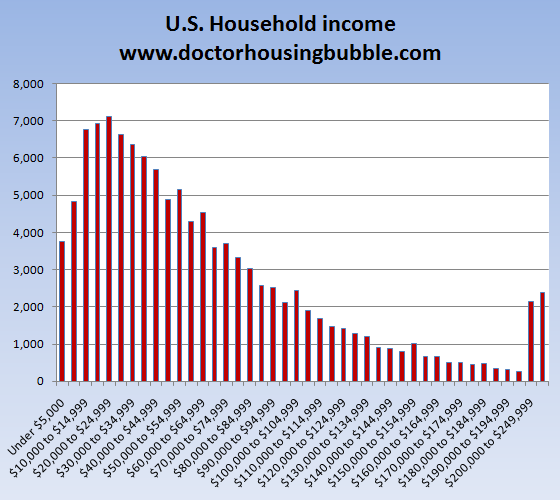
Interestingly, you can take the same data and make it a right-skewed distribution. This positively-skewed graph plots number of household’s income brackets:
Mean and median in skewed distributions
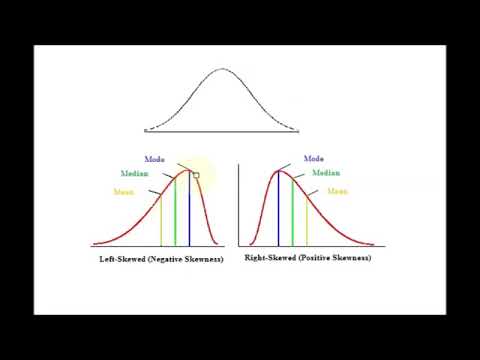
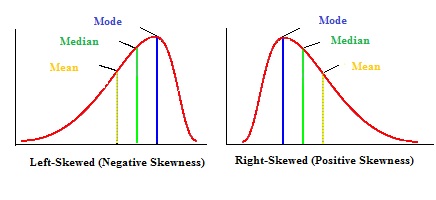
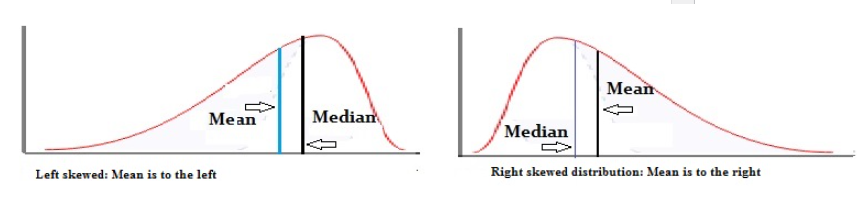
In a normal distribution, the mean, median, and mode are all equal. However, in a skewed distribution, the mean, median, and mode are usually different. The mean is especially sensitive to skewed data, so it’s exact location is hard to predict, except relative to the median and mode.
- Positively skewed distributions have longer tails on the right side of the distribution, which results in more values that are greater than the mean. The mean of a positively skewed distribution is greater than the median and the mode.
- Negatively skewed distributions have longer tails on the left side of the distribution, so there there are more values that are less than the mean. The mean of a negatively skewed distribution is less than the median and the mode.
These facts result in an important rule of thumb that you can use to find out if a particular distribution is positively or negatively skewed:
- If the mean is greater than the mode or less than the median (or both), the distribution is positively skewed.
- If the mean is less than the mode or less than the median (or both) the distribution is negatively skewed.
Some distributions are more skewed than others. Although this doesn’t change the rule of thumb, it does affect the usefulness of the mean as a measure of centrality. With a slightly skewed distribution, the mean may not be affected much, but with a heavily skewed distribution, the mean becomes a very poor measure of central tendency.
The normal distribution is the easiest distribution to work with in order to gain an understanding about statistics. Real life distributions are usually skewed. Too much skewness, and many statistical techniques don’t work. As a result, advanced mathematical techniques including logarithms and quantile regression techniques are used.
What is an asymmetric distribution?
An asymmetric distribution is any distribution that isn’t symmetric. In other words, the left and right portions of the data are not mirror images. The terms asymmetric and skewed are often used interchangeably, but they are not the same thing.
- Asymmetrical distributions include any distribution that lacks symmetry around the mean.
- A skewed distribution is a specific type of asymmetric distribution with a long tail that “pulls” the mean away from the center.
A bimodal distribution is an example of a probability distribution that is often asymmetrical but not skewed. It consists of two peaks, or modes, indicating the presence of two distinct groups of data points. Unlike a symmetric distribution, the mean of a bimodal distribution is located between the two peaks.
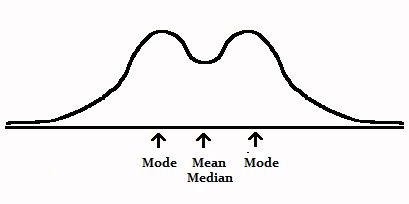
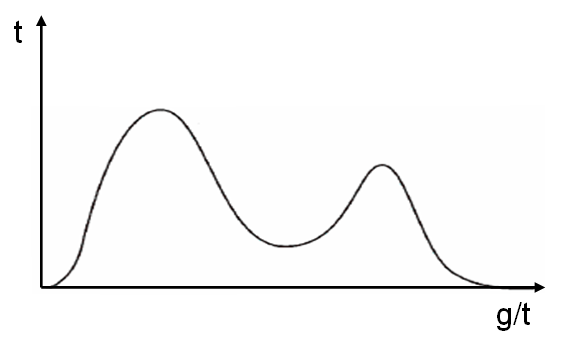
One major difference between a bimodal distribution and a skewed distribution is that the mean of a bimodal distribution is not influenced by a long tail. Other types of distributions that are usually asymmetric — but not skewed include trimodal distributions (three peaks) and multimodal distributions.
It isn’t always obvious whether or not a distribution is skewed merely by looking at a graph. We can calculate a numerical value for skewness with tools such as the skewness test and excess kurtosis test. A distribution with a skewness of zero is symmetrical; any other number for skewness means that the distribution is asymmetric. That said, while we can use skewness to describe asymmetric distributions, there isn’t a rigorous mathematical foundation to establish what is meant by “kurtosis of an asymmetric distribution” and what is needed to measure it properly [2].
When modeling stock market volatility, Gabaix et al. [3] consider distributions with large values of moment based skewness and kurtosis and goes as far as stating that “The use of [moment] kurtosis should be banished from use with fat-tailed distributions.”
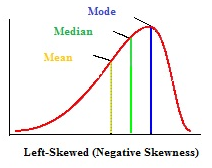
More on left skewed distribution (negative skew)
A distribution with a left skew is sometimes called negatively skewed because it’s long tail is on the negative direction on a number line. A common misconception is that the peak of distribution is what defines “peakness.” In other words, a peak that tends to the left is “left skewed.” This is incorrect. There are two main things that make a distribution skewed left:
- The mean is to the left of the peak. This is the main definition behind “skewness”, which is technically a measure of the distribution of values around the mean.
- The tail is longer on the left.
- In most cases, the mean is to the left of the median. This isn’t a reliable test for skewness though, as some distributions (i.e. many multimodal distributions) violate this rule. You should think of this as a “general idea” kind of rule, and not a set-in-stone one.
Skewness can be shown with a list of numbers as well as on a graph. For example, take the numbers 1,2, and 3. They are evenly spaced, with 2 as the mean (1 + 2 + 3 / 3 = 6 / 3 = 2). If you add a number to the far left (think in terms of adding a value to the number line), the distribution becomes left skewed:
-10, 1, 2, 3.
Similarly, if you add a value to the far right, the set of numbers becomes right skewed:
1, 2, 3, 10.
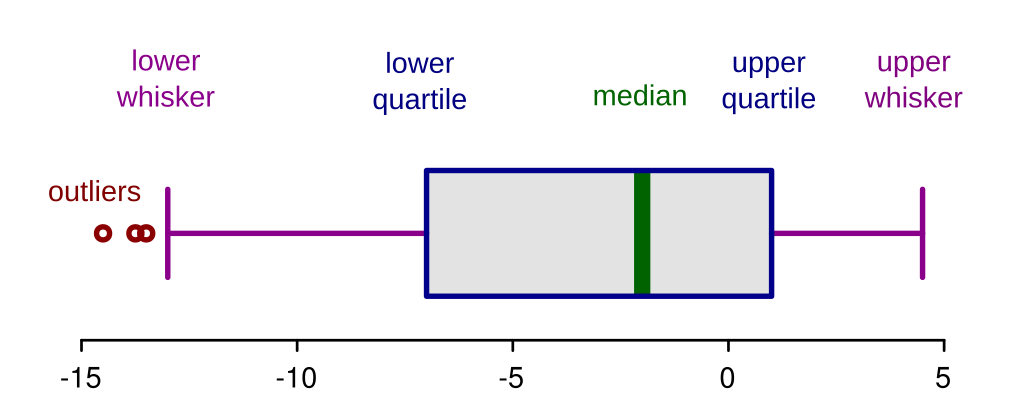
Left skewed boxplot
If the bulk of observations are on the high end of the scale, a boxplot is left skewed. Consequently, the left whisker is longer than the right whisker.
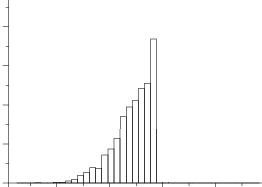
Left skewed histogram
Left skewed histograms are Histograms with long tails on the left.
Skewed Right / Positive Skew
A distribution with a right skew is sometimes called a positive skew distribution. That’s because the tail is longer on the positive direction of the number line.
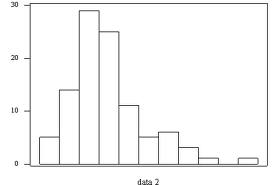
Right Skewed Histogram
A histogram is right skewed if the peak of the histogram veers to the left. Therefore, the histogram’s tail has a positive skew to the right.
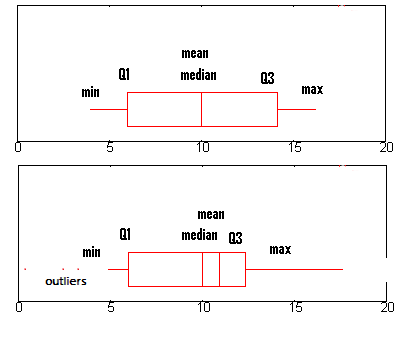
Right Skewed Box Plot
If a box plot is skewed to the right, the box shifts to the left and the right whisker gets longer. As a result, the mean is greater than the median.
Right Skewed Distribution Mean and Median
The rule of thumb is that with a right skew, the mean is usually to the right of the median.
However, like most rules of thumb, there are exceptions. Most distributions with right skew you come across in elementary statistics will have the mean to the right of the median.
The Journal of Statistics Education [4] points out an exception to the rule: In a data analysis course, a third moment formula calculates the skew. Consequently, some distributions can break the rule of thumb.
The following distribution was made from a 2002 General Social Survey. Respondents stated how many people older than 18 lived in their household. This is a right-skewed graph, but the mean is clearly to the left of the median.
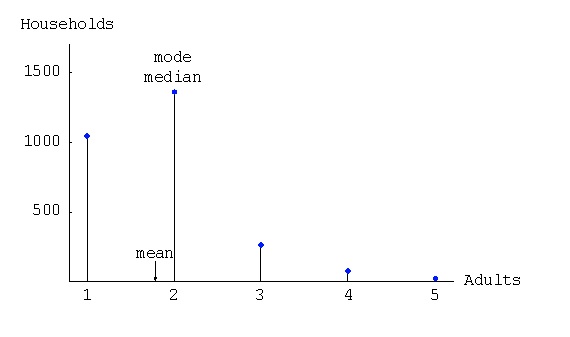
There are other exceptions which most involve theoretical mathematics and calculus. The important point to note is that although the mean is generally to the right of the median for distributions with right skew, it isn’t an absolute fact.
Skew Normal Distribution
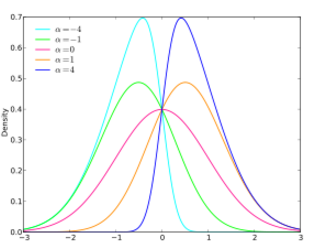
The probability density function for the skew normal, showing various alphas [5].
The skew normal distribution is a normal distribution with an extra shape parameter, α. The shape parameter skews the normal distribution to the left or right. As it is only the skew of the normal distribution that’s being changed, the skew normal family has many of the same properties of the normal distribution:
- It’s defined over the real number line.
- The square of a random variable is a chi-square variable (from a chi-square distribution) with one degree of freedom.
- The distribution is unimodal (one peak).
- The location parameter, μ(i.e. the mean), defines where the peak is and the scale parameter, σ(i.e. the standard deviation) determines the distribution’s spread.
The skew normal has a number of interesting properties related to alpha:
- If the skew normal has a skew of zero, then it becomes the normal distribution.
- If the sign of alpha changes, the distribution will flip over the y-axis.
- As alpha increases (in absolute value), the skew also increases.
- As alpha tends towards infinity, the series converges to the folded normal density function.
Therefore, the normal distribution can be seen as a special case of the skew normal distribution. This is a relatively new distribution, introduced by O’Hagan and Leonard in 1976 in a paper on Bayes’ estimation [6]. The work was a basic overview and it wasn’t until the 1980s that an in-depth analysis of the distribution was published. It is mainly used in threshold autoregressive stochastic processes and in time series analysis, but can also be used to model various phenomena in a wide range of fields from the sciences to the stock market.
How to analyze a skewed distribution
- Use the median: The median is more robust than the mean as a measure of central tendency. The median is the middle value in a distribution, where values are arranged from smallest to largest, which makes it resistant to outliers (very high or low values that don’t fit with the rest of the data).
- Analyze the interquartile range (IQR):The interquartile range is a measure of variability that is not affected by outliers. This is because it only takes into account the middle 50% of data. It’s calculated as the difference between the 75th and 25th percentiles.
- Transformations can also be applied to analyze skewed data. Transformations are mathematical operations that alter the scale or shape of a distribution. Common transformations for skewed data include:
- Logarithmic transformation: Often applied to data skewed to the right.
- Exponential transformation: Typically applied to data skewed to the left.
- Box-Cox transformation: A more comprehensive transformation applicable to data skewed in either direction.
The best method to analyze skewed data depends on the data and your end goal in analysis. In informal cases, using the median or the IQR may be enough. In others, such as journal publication, a transformation might be required.
Skewed distributions can be quantified a measure called skewness:
- A value of 0 means that the distribution is symmetric.
- A value greater than 0 means that the distribution is positively skewed.
- A value less than 0 means that the distribution is negatively skewed.
References
- By Geek3 (Own work) [GFDL
- Eberl, A. & Bernhard, K. Centre-free kurtosis orderings for asymmetric distributions. Retrieved July 13, 2023 from: https://publikationen.bibliothek.kit.edu/1000156220
- By Ruediger85 (changed language). Original by RobSeb (Own work) CC-BY-SA-3.0 , via Wikimedia Commons.
- GABAIX, X., GOPIKRISHNAN, P., PLEROU, V. & STANLEY, H. (2006). Institutional investors and stock market volatility. The Quarterly Journal of Economics 121, 461–504.
- Image: skbkekas|Wikimedia Commons. CC-BY-SA-3.0
- Journal of Statistics Education. Retrieved April 16, 2021 from: http://www.amstat.org/publications/jse/v13n2/vonhippel.html