Statistics Definitions > Variability
What is Variability in Statistics?
Variability, also called spread or dispersion, tells us how much a dataset is spread out. It can explain how much datasets differ, giving us a numerical way to compare datasets. The four main ways to describe variability in a data set are:
Measures of variability in statistics
1. The range
The range is the difference between the smallest and largest items in the dataset. It is calculated by subtracting the smallest number from the largest. As a formula, that’s
Range = Maximum value – Minimum value
For example, if your earnings were $200 one week, $300 the next week, and $400 the third week, the range for your pay would be:
Range = $400 – $200 = $200.
In other words, your pay can vary by as much as $200 between weeks — sometimes going as high as $400 and other times going as low as $200.
The range is simple to calculate, but it can be a very unreliable measure of variability — especially if your data has outliers [1].
2. The interquartile range (IQR)
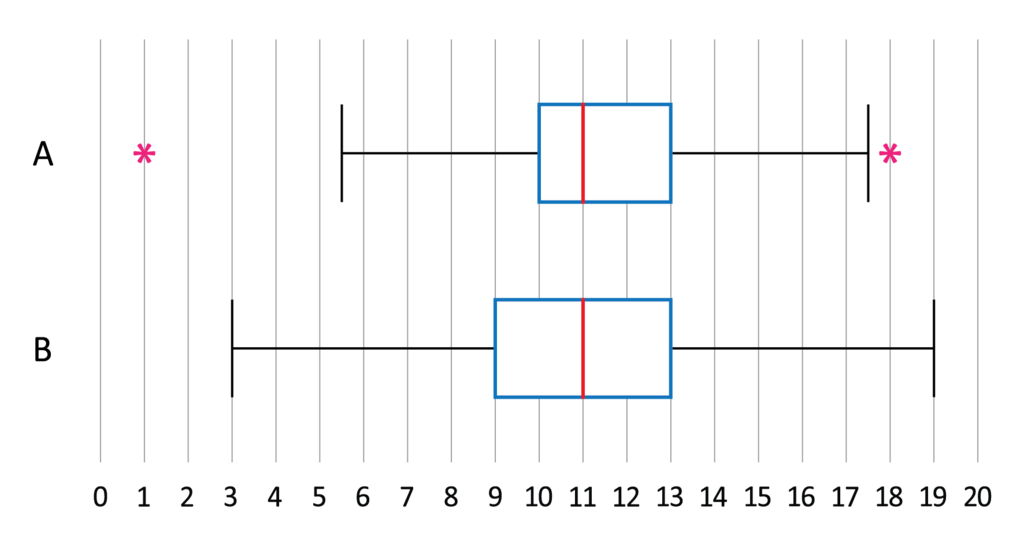
The interquartile range (IQR) is similar to the range, but it describes the middle fifty percent rather than 100% of the data. This measure can sometimes be more informative than the range because it indicates where the majority of your values are located.
he formula for the interquartile range is
IQR = Q3 – Q1,
where
- Q1 = first quartile
- Q3 = third quartile.
Basically, you’re subtracting a value near the lower end (Q1 is at the 25th percentile mark) from a value near the higher end (Q3 is at the 75th percentile mark).
3. Variance
Variance give us a general sense of how dispersed data is. A smaller variance suggests your data is closely grouped together, while a larger variance implies that the values are more widely scattered.
Variance is seldom useful for real life applications as it’s difficult to interpret its meaning. It’s usually reserved for calculating the standard deviation.
4. Standard deviation
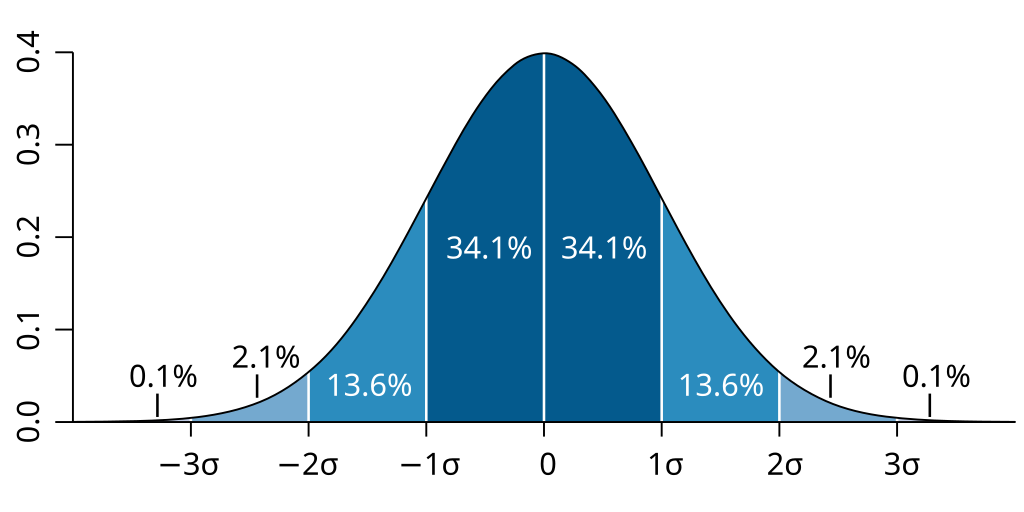
The standard deviation indicates how closely your data is gathered around the mean, or average. A smaller standard deviation (e.g., -1 or 1) suggests that your data is tightly clustered, while a larger standard deviation indicates that your data is more spread out.
What causes variability in statistics?
Many different elements can contribute to variability in statistics, including:
- Built-in variation: Individuals or objects often have built in differences. For instance, even within the same population, people’s heights will naturally differ.
- Measurement Error: This relates to inaccuracies that happen during the measurement process. For example, if you measure a person’s height with an imprecisely calibrated ruler, the result might be incorrect.
- Sampling Error: This concerns errors that arise when data is gathered from a small sample of a larger population. For example, if you gather data from just 5 individuals in a population of 1000, the sample may not accurately represent the entire population.
- Systematic Error: This involves errors that consistently occur in a specific direction. For instance, if you consistently underestimate people’s heights, you are introducing a systematic error into your data.
These just a few examples of factors that can induce variability in statistics — there are many more, including changes in the data collection context, the population from which you draw samples, or changes in the measurement process such as a worn out instrument. It’s important to be aware of these factors to understand your data’s limitations and make educated decisions about interpreting it.
Is variability in statistics the same as standard deviation?
No, variability and standard deviation are not identical. Variability is a broader term that indicates how spread out data points are within a dataset. On the other hand, standard deviation is a precise measure of variability, derived by taking the square root of the variance.
In sum, while standard deviation is a method to quantify variability, it is not the only measure. Variability encompasses more than just the standard deviation.
References
- Maricopa Community College. 5 Introduction to statistics for psychology. Chapter 5: Measures of Dispersion
- Ederporto, CC BY-SA 3.0 https://creativecommons.org/licenses/by-sa/3.0, via Wikimedia Commons
- M. W. Toews via Wikimedia Commons. Creative Commons Attribution 2.5