Probability and Statistics > Non normal Distributions > Gamma Distribution
The gamma distribution is a family of right-skewed, continuous probability distributions. These distributions are useful in real-life where something has a natural minimum of 0. For example, it is commonly used in finance, for elapsed times, or during Poisson processes.
Gamma Distribution PDF
If X is a continuous random variable then the probability distribution function is: 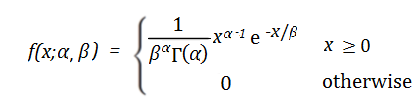
Where
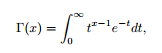
- Γ(x) = the gamma function:
- α = The shape parameter.
- β (sometimes θ is used instead) = The rate parameter (the reciprocal of the scale parameter).
α and β are both greater than 1. When α = 1, this becomes the exponential distribution. When β = 1 this becomes the standard gamma distribution. Alpha and beta define the shape of the graph. Although they both have an effect on the shape, a change in β will show a sharp change, as shown by the pink and blue lines in this graph:

You can think of α as the number of events you are waiting for (although α can be any positive number — not just integers), and β as the mean waiting time until the first event. If α (number of events) remains unchanged but β (mean time between events) increases, it makes sense that the graph shifts to the right as waiting times will lengthen. Similarly, if the mean waiting time (β) stays the same but the number of events (α) increases, the graph will also shift to the right. As α approaches infinity, the gamma closely matches the normal distribution. The three-parameter gamma distribution is a generalization of the 2-parameter gamma distribution with an additional threshold parameter.
Mean, Variance, MGF
Mean: E(X) = αβ
Variance: var(X) = αβ2
Moment generating function: MX (t) = 1 /(1 − βt)α
How to Find Gamma Distribution Probabilities in Excel
Step 1: Type “=GAMMA.DIST(” into an empty cell.
Step 2: Type the value where you want to find the probability. For example, if you want to find the probability at x=6, the function becomes “=GAMMA.DIST( 6”
Step 3: Type your α and β values, separated by a comma. For example, if your α is 3 and β is 2, the function becomes: “=GAMMA.DIST( 6, 3, 2”
Step 4: Type FALSE, close the parentheses and then hit the “enter” key. The entire function is “=GAMMA.DIST( 6, 3, 2, FALSE” Excel will return the probability as 0.112020904.
Tip: To find the cumulative probability, type TRUE instead of FALSE in Step 4.
MATLAB.
The gamma distribution is calculated in MATLAB using the prob.GammaDistribution object. You can find full instructions on how to find the distribution in MATLAB here on the MathWorks site.
Related Distributions
- The gamma is a special case of the Tweedie distribution (when p = 2).
- For integer degrees of freedom, the Wishart distribution is the multivariate counterpart of the gamma distribution.
- The inverse gamma distribution has the same distribution as the reciprocal of a gamma distribution. It is mainly used in Bayesian hypothesis testing.
- The Erlang distribution and chi-square distribution are special cases of the gamma distribution. The Erlang distribution happens when α is any positive integer. The exponential distribution is also a special case of the gamma distribution. The gamma and exponential are very similar, as shown by this graph. The two curves have identical means but different standard deviations:

The gamma and exponential are very similar, as shown by this graph. The two curves have identical means but different standard deviations [1].

The Inverse Gaussian also has a similar shape to the gamma. In fact, they can look exactly the same given the right parameters. However, it’s easier to produce extremely large values with the inverse Gaussian.
Gamma distribution vs. normal distribution
The gamma and normal distribution are both members of the exponential family of distributions. One difference between the two is how their parameters are defined: the normal distribution’s parameters are called the mean and standard deviation, while the gamma’s parameters are called shape and scale. A three parameter gamma distribution has an additional parameter called a threshold parameter, which determines the theoretical limits for the distribution.
The major difference is the shape of the distribution: the normal distribution is always symmetric around a single bell-shaped hump for the entire range of real numbers while the gamma may or may not have a hump, is not symmetric, and is only defined for positive real numbers [2].
What is the gamma distribution used for?
The gamma distribution can be used to model the same types of phenomena as the exponential distribution, including failure times, service times, and wait times. The most frequent use case is to model the time between independent events that occur at a constant average rate. Using this distribution, you can specify the number of events, such as modeling the time until the 3rd of 4th accident occurs. In this context, the gamma distribution models failure times in reliability analysis.
As a visualization of what the PDF means, α is the number of events in the queue (although α can be any positive number — not just integers), and β is the mean waiting time until the first event. If α remains unchanged but β increases, wait times have increased so the graph shifts to the right. Similarly, if β stays the same but α increases, the graph will also shift to the right. As α approaches infinity, the gamma closely matches the normal distribution.
The gamma distribution is often used in Bayesian inference. For example, y could be modeled as a mean measure of a count variable, which is the number of times an event occurs. You could use a gamma prior for the λ parameter of a Poisson distribution; That’s because the gamma distribution is only defined for λ≥ 0. The gamma distribution could also be used as a prior for a decision parameter — a quantity we want to estimate or make a decision about — because of its conjugate properties for precision modeling [3].

References
[1] Gamma vs exponential graph retrieved 1/1/2023 from: http://homepages.cae.wisc.edu/~ie642/content/Techniques/Gamma/gamma_distribution.html
[2] Getting Started with Gamma Regression. Retrieved August 18, 2023 from: https://library.virginia.edu/data/articles/getting-started-with-gamma-regression
[3] Artemiou, A. (2009). Chapter 4 — Lecture 4 The Gamma Dist. and its Relatives. Retrieved November 3, 2017 from: http://www.math.mtu.edu/~aartemio/Courses/Stat318/Lectures/Chapter4/Chapter4_Lecture4.pdf.