Statistics Definitions > What is a Scale Parameter?
A scale parameter stretches or squeezes a graph. They are used with location parameters to determine the shape and location of a distribution.
Scale Parameter’s Effect on Graphs
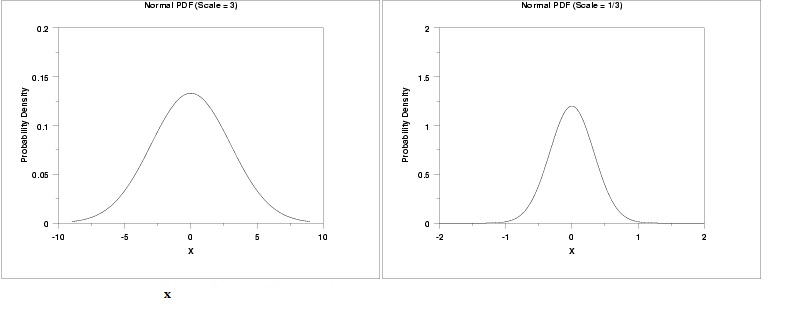
The graph on the left has a scale parameter of 3; The graph on the right has a scale parameter of 1/3. The effect of changing the scale parameter from 3 to 1/3 is squeezing the graph: the graph on the left is between -10 and 10 on the horizontal axis while the graph on the right is between -2 and 2.
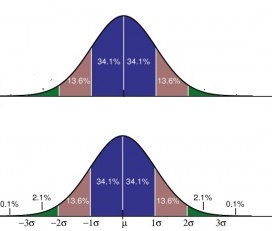
Scale parameters give meaning to graphs. In a standard normal model, the scale is equal to the standard deviation, σ. Without a scale on a graph, you can’t extract any information from it, even given that the area under the graph is 1. The top graph here is a standard normal distribution without any scale parameters. The bottom graph has scale parameters written as standard deviations:

The scale is equal to the standard deviation is only true for the standard normal probability distribution. In most other distribution types, the scale will not equal the standard deviation.
General Rules
The larger the scale parameter, the more spread out the distribution. The smaller the parameter, the more compressed the distribution. A scale parameter:
- …of zero will result in a single, vertical line at 0 (a spike).
- …between zero and 1 will squeeze the distribution horizontally.
- …exactly 1 leaves the distribution unchanged.
- …more than 1 stretches the graph horizontally.
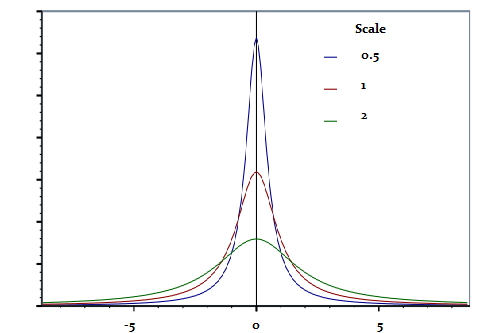
The above graph shows the effect of parameters. As the graph shrinks horizontally with smaller scales, the graph also grows taller. Why? Because the area under the curve has to equal 1, so all the area has to go up if it’s width shrinks.
References
Balakrishnan, N. and Cohen, A. C. Order Statistics and Inference. New York: Academic Press, 1991.
Wheelan, C. (2014). Naked Statistics: Stripping the Dread from the Data.

