Probability Distributions > Multimodal Distribution
What is a Multimodal Distribution?
A multimodal distribution is a probability distribution with more than one peak, or “mode.”
- A distribution with one peak is called unimodal
- A distribution with two peaks is called bimodal
- A distribution with two peaks or more is multimodal
A bimodal distribution is also multimodal, as there are multiple peaks.
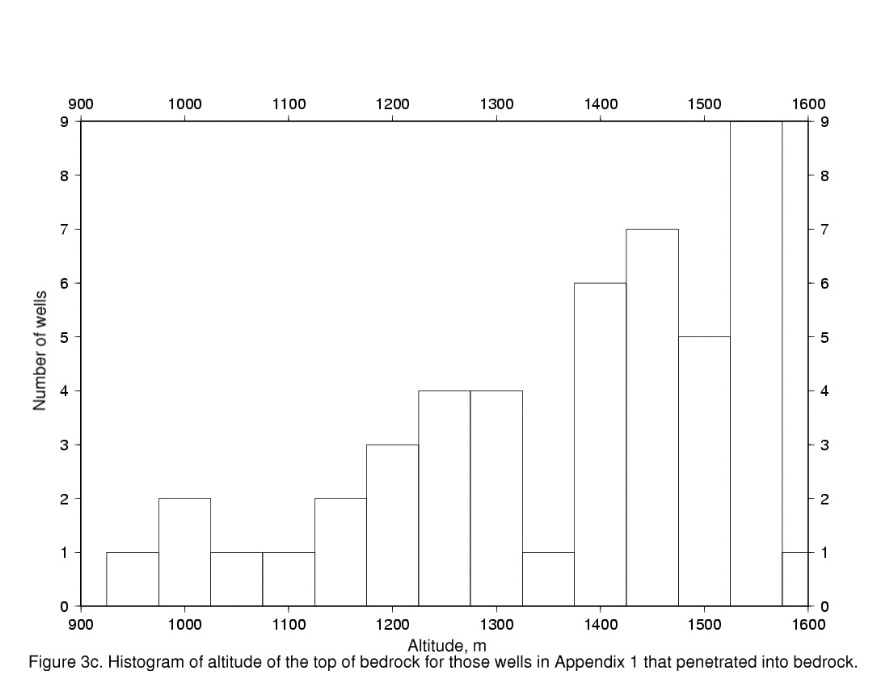
A comb distribution is so-called because the distribution looks like a comb, with alternating high and low peaks. A comb shape can be caused by rounding off. For example, if you are measuring water height to the nearest 10 cm and your class width for the histogram is 5 cm, this could cause a comb shape.

An edge peak distribution is where there is an additional, out of place peak at the edge of the distribution. This usually means that you’ve plotted (or collected) your data incorrectly, unless you know for sure your data set has an expected set of outliers (i.e. a few extreme views on a survey).

A multimodal distribution is known as a Plateau Distribution when there are more than a few peaks close together.

Causes of a Multimodal Distribution
A multimodal distribution in a sample is usually an indication that the distribution in the population is not normal. It can also indicate that your sample has several patterns of response or extreme views, preferences or attitudes.
When thinking about the cause of the multimodality, you may want to take a close look at your data; what may be going on is that two or more distributions are being graphed at the same time. This is opposed to a true multimodal distribution, where only one distribution is mapped. For example, the following image shows two groups of students, one of which studied (the peak on the left) and one of which didn’t (the peak on the right).

References
Emory, Oxford College. http://mathcenter.oxford.emory.edu/site/math117/shapeCenterAndSpread/