Descriptive Statistics > Shapes of Distributions
What Defines Shapes of Distributions?
When a data set is graphed, each point is arranged to produce one of dozens of different shapes. The distribution shape can give you a visual which helps to show how the data is:
- Spread out (e.g. dispersion, variability, scatter),
- Where the mean lies,
- What the range of the data set is,
…and many other useful statistics. Shapes of distributions are defined by several different factors:
1. Number of peaks
The peaks are usually called modes; Sometimes they are called “local maximums“, but that term is more commonly used in calculus. The mode tells you that the data count is higher in these areas than in any other areas on the graph.
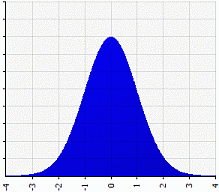
- A unimodal distribution has one mode. A single peak can take on many shapes (e.g. very tall and thin or very squat and fat). One of the most common types of unimodal distributions is the normal distribution, sometimes called the “bell curve” because its shape looks like a bell.
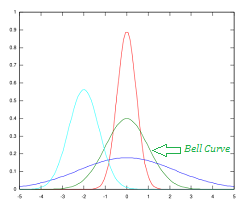
Several unimodal distributions plotted on the same graph. The green “bell curve” is the normal distribution.
- A bimodal distribution has two modes.
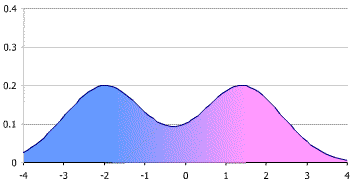
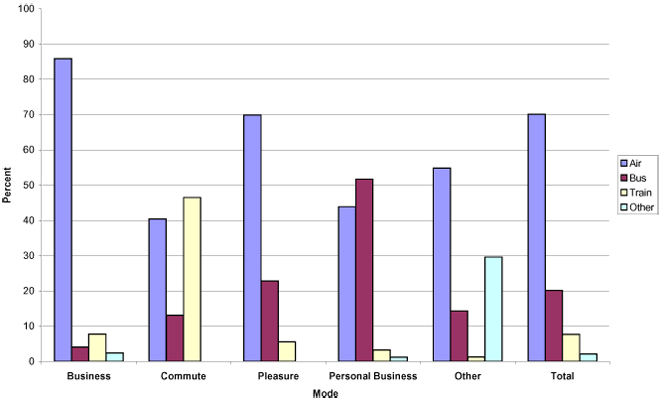
Bimodal distribution. - A multimodal distribution has three or more modes.

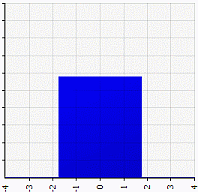
Multimodal distribution with many modes, or peaks. Image credit: USDOT - If a data set has no clear peaks (i.e. the whole graph looks flat), it’s called a “uniform distribution.”

A uniform distribution.
Terminology Note
One of the most confusing aspects about statistics is the terminology, and the “mode” is no exception. It may seem at first glance that the word has two meanings:
- The most common number in a set. For example, the mode of 1, 2, 2, 3, 5 is the number “2”.
- A word to describe a peak on a graph.
However, the two terms actually mean the same thing. The most common number in the above list of numbers is “2”. If you were to plot that set of numbers on a graph, the peak would happen at x = 2, which means that the peak contains the most common number in the set. That said, if you are asked to “Find the Mode“, that usually indicates you should look for the most frequent item in the set; it doesn’t mean you have to create a graph.
2. Symmetry
A symmetric graph has two sides that are mirror images of each other. The normal distribution is one example of a symmetric graph.
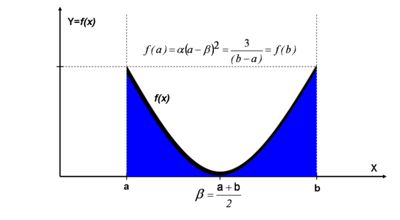
Another type of symmetric graph is the U-distribution, which—perhaps not surprisingly— looks like the letter “U”.
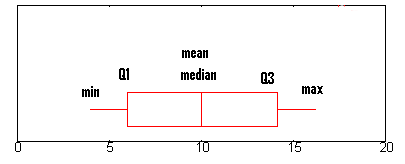
A symmetric box plot has the “box” in the center of the graph:
3. Skewness
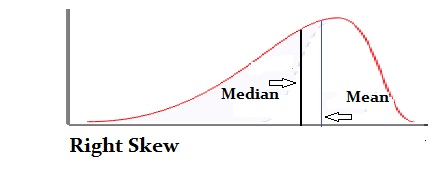
Shapes of distributions can differ in skewness; these distributions are not symmetrical distributions. Instead, they have more points plotted on one side of the mean than on the other. This causes long tails either in the negative direction on the number line (a negative, or left skew) or in the positive direction on the number line (a positive, or right skew). For more on how skewness affects shapes of distributions, see: Skewed Distribution in Statistics.
The tails of a distribution (i.e. how thin or fat they are) can also be described by kurtosis, which is measured against the standard normal distribution. A positive value for kurtosis means you have a large peak and little data in the tails. A negative value means you have a flattened peak with lots of data in the tails.