Descriptive Statistics > Symmetric Distribution
What is a symmetric distribution?
A symmetric distribution is a type of distribution where the left side of the distribution mirrors the right side. A symmetric distribution is never skewed . In contrast, an asymmetric distribution is one with left and right portions that are not mirror images.
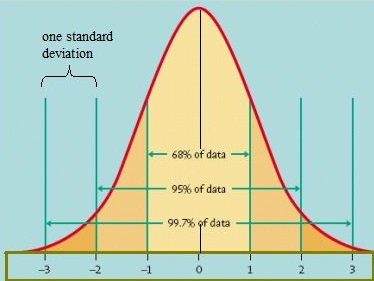
The normal distribution is an example of a symmetric distribution. It is also a unimodal distribution (it has one peak).
Distributions don’t have to be unimodal to be symmetric. They can be bimodal (two peaks) or multimodal (many peaks). The following bimodal distribution is symmetric, as the two halves are mirror images of each other. 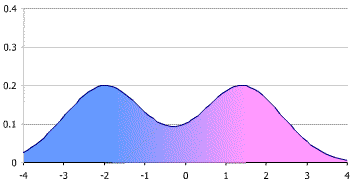
How do you know if a distribution is symmetrical?
A symmetric distribution has a couple of distinct characteristics that make it unique from other types of distributions:
- Values on either side of the center are equal, meaning that if you were to draw a vertical line down the center of the distribution, both sides would be mirror images. Therefore, the mean, median and mode tend to occur at the same point (in the center).
- A symmetric distribution will usually have one peak where most of its values are clustered around that peak value. There are exceptions; in theory, a bimodal or multimodal distribution could have two halves that are mirror images (as shown in the above image), but this is very rare and practically impossible for real-life data.
The normal (Gaussian) distribution is perhaps the most well-known example of a symmetric distribution. As with any bell-shaped curve, it has one peak or mode in the middle and its left and right sides mirror each other perfectly. This type of distribution is often used to describe natural phenomena such as heights or weights, since they tend to cluster around an average value (μ) with few extreme outliers.
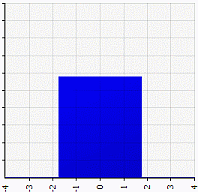
Another type of symmetric distribution is the uniform distribution, which describes data that is equally spread out over a range without any peaks or dips. This type of data can sometimes be found when measuring things such as exam scores or temperatures. You might also find this shape when looking at data about age groups or income levels, since these variables tend not to show much variation within individual populations.
Mean, Mode and Median of a Symmetric Distribution
In a symmetric distribution, the mean, mode and median all fall at the same point. The mode is the most common number and it matches with the highest peak (the “mode” here is different from the “mode” in bimodal or unimodal, which refers to the number of peaks). 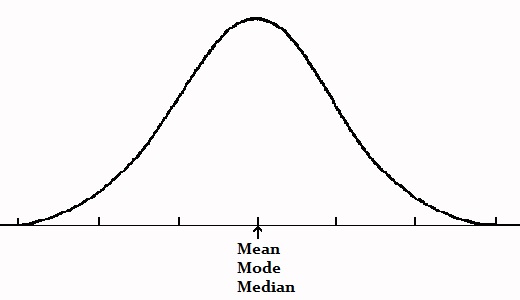
An exception is the bimodal distribution. The mean and median are still in the center, but there are two modes: one on each peak. 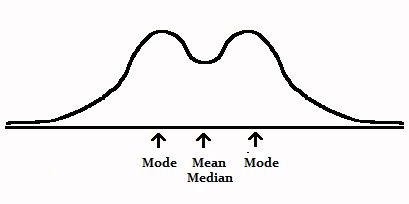
Symmetrical distribution vs. asymmetrical distribution
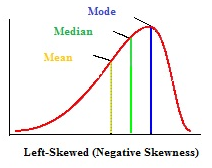
A symmetrical distribution has two halves that are mirror images of each other; This means that the mean, median, and mode are all equal. An asymmetrical distribution, on the other hand, is a distribution where the values on either side of the mean are not mirror images of each other. Consequently, the mean, median, and mode are not all equal.
The right-skewed distribution is an asymmetrical distribution where the tail on the right side of the distribution is longer than the tail on the left side. It is commonly used to represent positively skewed data, such as income data. Similarly, the left-skewed distribution is an asymmetrical distribution where the tail on the left side of the distribution is longer than the tail on the right side. It is often used to model negatively skewed data, such as test scores.
The exponential distribution is an example of an asymmetrical distribution where the probability of a value occurring decreases exponentially as the value increases. It is often to model for the time it takes for an event to occur, such as decay of a radioactive atom.
![Graph of The exponential distribution , a popular way to model lifetimes [1].](https://www.statisticshowto.com/wp-content/uploads/2023/09/Exponential_distribution_cdf_-_public_domain.svg_.png)
Limitations of a symmetric distribution
Symmetrical distributions such as the normal distribution are often used in statistics because they are relatively easy to work with. However, they do have some limitations.
- Perhaps the biggest limitation is that they may not accurately represent real-world data, which is often not symmetrical. For example, income data is often skewed, with more individuals with low incomes than high incomes.
- Another limitation is that if data does perfectly fit a symmetrical shape, this is often transitory, which means that the data behind the curve will fluctuate over time (for example, tests may get harder, weight distributions may shift). This makes it difficult to rely on a symmetrical distribution for anything more than a rough estimate of real-world behavior.
- In addition, symmetrical distributions are not used very often to model data with two distinct populations. That limits its use cases to single populations.
Common symmetric distributions
The normal distribution is the symmetric distribution you’re most likely to come across in elementary statistics. However, there are other distributions that display symmetry:
- The bimodal distribution can be symmetrical if the two peaks are mirror images.
- Cauchy distributions have symmetry. You’re unlikely to come across these in elementary stats. They are a family of distributions where the expected value doesn’t exist.
- The logistic distribution, which has long tails. The logistic and Cauchy distributions are used if the data is symmetric but there are more extreme values than you would expect to find in a normal distribution. Read more about these distribution types here.
- The uniform distribution is symmetric. The probabilities are exactly the same at each point, so the distribution is basically a straight line. An example of a uniform probability distribution could be picking a card from a deck: the probability of picking any one card is the same: 1/52.
Symmetric distribution vs. normal distributions
A normal distribution is a type of symmetrical distribution. A symmetrical distribution is a more general term that can refer to any distribution that is symmetric around the center point. A symmetrical distribution is any probability distribution where the values on either side of the mean are mirror images. There are many types of symmetrical distributions other than the normal distribution, including the uniform distribution, and the exponential distribution.
How do you know if data is symmetric or skewed?
To figure out if data is symmetric or skewed, look at the graph of the distribution. A symmetrical distribution will be perfectly centered, with one half that mirrors the other. Another way to find out if a distribution is skewed is to compare the mean, median and mode. In a symmetrical distribution, these are equal. If they are not equal, the curve is not symmetrical. Some statistical tests can be used for this purpose. For example, the D’Agostino skewness test calculates a measure of skewness to indicate whether the data is symmetrical or skewed.
What skewness is symmetric?
A symmetric distribution has a skewness of 0, which means that the distribution is not off-center at all. Symmetrical distributions with a skewness of 0 include:
- Exponential distributions
- Normal distributions
- Uniform distributions
When a distribution has zero skewness you can confidently conclude that the mean, median, and mode are all the same.
Real life examples of a symmetric distribution
Symmetric distributions are rare in real-life data, but they can be found. A few examples:
- Heights and weights: The distribution of heights and weights in populations tends to be symmetric. This happens because there are equal numbers of individuals taller and shorter (or wider and thinner) than average.
- IQ scores: IQ scores in a population typically shows symmetry. This happens because IQ scores are designed to follow a normal distribution with a mean of 100 and a standard deviation of 15.
- Distribution of test scores: The distribution of grades in a class is usually symmetrical or bimodal [1]. A symmetric distribution of grades happens because most students tend to receive scores around the average, with a few scoring higher and a few scoring lower. In some cases, the class is split into two, with many A students and many Fs. This can, in some cases, also produce a symmetric distribution.