Contents (Click to skip to that section):
How is wealth distributed in the United States? Which drugs work to cure cancer? Which stocks should I invest in? All of these questions can be answered with data analysis.
Data Analysis Definition
Data Analysis is basically where you use statistics and probability to figure out trends in data set. It helps you to sort out the “real” trends from the statistical noise. What is “noise”? A large amount of data that doesn’t seem to mean anything at all (sometimes it can be impossible to see the trees because of the forest!). If you’ve ever tried to make sense of the figures and numbers in a copy of the Wall Street Journal, you’ll know what “noise” means.

Back to Top
Techniques.
The type of data analysis you use depends on what kind of study you’re doing. For example, you would use a different technique for data gathered from interviews than you would for an analysis of stock market trends. Some techniques you might use are:
- General linear model: Useful for assessing how several variables affect continuous variables. Example: ANOVA tests.
- Generalized linear model: Used for discrete variables. Example: Linear Regression (What is Linear Regression?).
- Structural equation modelling: Used for abstract variables like “Soap preference,” “Intelligence,” or “Future goals.” SEM helps you to figure out if you have a valid model for your data.
- Item response theory: A way to analyze results from tests, exams, and questionnaires.
It’s vital you use the right technique; Using the wrong one can lead to faulty claims about your data. There are dozens of examples of faulty claims about data on the internet. Perhaps two of the most famous are the Cold Fusion debacle and the now infamous data on women’s poor prospects of getting married over age 30.
Back to Top
The Two Tools of Data analysis.
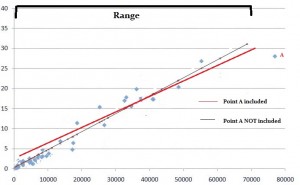
The two main tools that make up data analysis are lines and tables. For example, you might create a line graph with a linear regression equation.

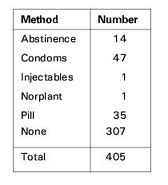
Or you could make a frequency distribution table to display data.

Back to Top
Variation
If life were simple, we could make a chart or a graph for every situation. But in real life, things are never as simple as they appear. Take a two-pound bag of sugar. Does it really weight two pounds? Measure a hundred bags of sugar and you’ll likely find a hundred different weights, from 5.0 pounds to 5.1 pounds and everything in between. That’s what we call variance, and variance is one of the reasons we have to use probability distributions to evaluate data.
Back to Top
The Three Rules of Data analysis.
Using three basic rules of thumb can help you avoid incorrectly making claims about your data:
- Look at your data and think about what it is you want to know. Do you want to prove that the Earth is round? Or do you want to prove that the Earth has a circumference? Framing this question is what we call stating the hypothesis.
- Estimate a Central Tendency for your Data. Examples of measures of central tendency are the mean and median. Which one you use will depend on your hypothesis in Step 1. For example, if you wanted to prove the Earth was round, you might choose to look at the average volume, or the average circumference.
- Consider the exceptions to the central tendency. If you’ve measured the average, look at the figures that are not average. If you’ve measured a median, look at the figures that don’t meet that expectation. Exceptions can help you spot problems with your conclusion. A simple example: your child’s average score in school is 70. Not bad, right? But if you look at the exceptions, you might find they are getting 100 in three classes (great!) and 40 in three other classes (uh oh). In this case, the average is completely misleading.
Issues with Data Analysis.
Why do so many cases of data analysis end with faulty claims? One of the main reasons is that analyzing data is a complicated and tedious process. It’s never as easy as plugging numbers into a computer. Some issues that can lead to faulty data analysis include:
- Not having the right analysis skills.
- Using the wrong tools to analyze data. For example, using a z score when your data doesn’t have a normal distribution.
- Letting bias influence your results.
- Not figuring out statistical significance.
- Incorrectly stating the null hypothesis and alternate hypothesis.
- Using misleading graphs and charts.
Unintentional reporting of bad results is usually the result of a lack of proper training. More than one study (including this one) found that physicians were very poorly trained in the proper management of clinical trials. Physicians were also very poorly trained in reading statistics from good data obtained from valid setups! (See: Even Physicians Don’t Understand Statistics). Why would highly educated people have so much trouble interpreting data analysis? Take a very simple example: A Word Count.
Example problem: You’re given an e-book of Shakespeare’s Romeo and Juliet. Your task is to find out how many times the Word “Love” appears in it. Easy, right? You run it through a word count in a word processor and you report that it’s found 126 times.
Oops. The word “love” is only found 94 times. Why is the word count so wrong? You failed to take into account all of the other words that contain the letters “love”:
- Loves (2).
- Loved (3).
- Loving (6).
- Love’s (12).
- Lover (4).
- Lover’s (3).
- Lovest (2).
Now imagine if you were analyzing a text on the results from blood analysis to see if a particular cancer drug worked or not. Perhaps you were looking for a specific chemical to see if it showed up more frequently than another. Typing in just part of the chemical name could lead you to a (possibly harmful) conclusion.
Back to Top
What is Exploratory Data Analysis?

Exploratory Data Analysis (EDA) is an approach to analyzing data. It’s where the researcher takes a bird’s eye view of the data and tries to make some sense of it. It’s often the first step in data analysis, implemented before any formal statistical techniques are applied. Although specific statistical techniques can be used, like creating histograms or box plots, EDA is not a set of techniques or procedures; the Engineering Statistics Handbook calls EDA a “philosophy.” EDA is considered by some to be more of an art form than a science.
Exploratory data analysis is a complement to inferential statistics, which tends to be fairly rigid with rules and formulas. EDA involves the analyst trying to get a “feel” for the data set, often using their own judgment to determine what the most important elements in the data set are. For example, multidimensional scaling is an EDA that uses visual representations of distances or similarities between sets of objects; It’s up to the user to interpret exactly what the distances represent.
Back to Top
Purpose of EDA
The purpose of exploratory data analysis is to:
- Check for missing data and other mistakes.
- Gain maximum insight into the data set and its underlying structure.
- Uncover a parsimonious model, one which explains the data with a minimum number of predictor variables.
- Check assumptions associated with any model fitting or hypothesis test.
- Create a list of outliers or other anomalies.
- Find parameter estimates and their associated confidence intervals or margins of error.
- Identify the most influential variables.
Other, specific knowledge can be obtained through EDA such as creating a ranked list of relevant factors. You may not necessarily include all of the above items in your data analysis, although it’s likely you’ll want to include at least a few. They should be viewed as guidelines, rather than rigid rules.
Types of Exploratory Data Analysis
EDA falls into four main areas:
- Univariate non-graphical — looking at one variable of interest, like age, height, income level etc.
- Univariate graphical.
- Multivariate non-graphical — analysis of multiple variables at the same time.
- Multivariate graphical.