- What is Kurtosis?
- Excess Kurtosis
- Calculations
- Platykurtic
- Leptokurtic
- Why Does Kurtosis Matter?
- The Peakedness Debate
1. What is Kurtosis?
Kurtosis tells us about the amount of data in the tails of a probability distribution.
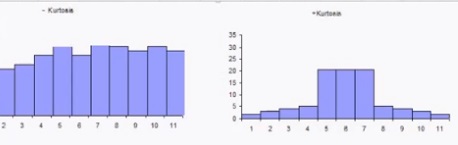
- A positive value tells you that you have heavy-tails (i.e. a lot of data in your tails). These distributions tend to look flatter than the normal distribution.
- A negative value means that you have light-tails (i.e. little data in your tails). These distributions often look more peaked than the normal distribution.
If you have a kurtosis close to 3, your data is considered nearly normal, with the tails slightly lighter or heavier than in an ideal standard normal distribution. According to some authors, it also tells us about the “peakedness” of a distribution. For example, a distribution with high kurtosis tends to have a distinct peak in the center with heavy tails, but this isn’t always the case.
Kurtosis is the fourth moment in statistics.
What is Excess kurtosis?
Excess kurtosis is a way to measure the deviation of tails in any given probability distribution from that of a normal distribution. Generally, if it’s zero or negative, there will be lighter tails than what one would expect in an ideal bell-shaped curve; on the other hand, heavier tails are expected when excess kurtosis is positive.
The following graph shows a variety of distributions. Note how the tails are fatter or thinner than the normal (black):
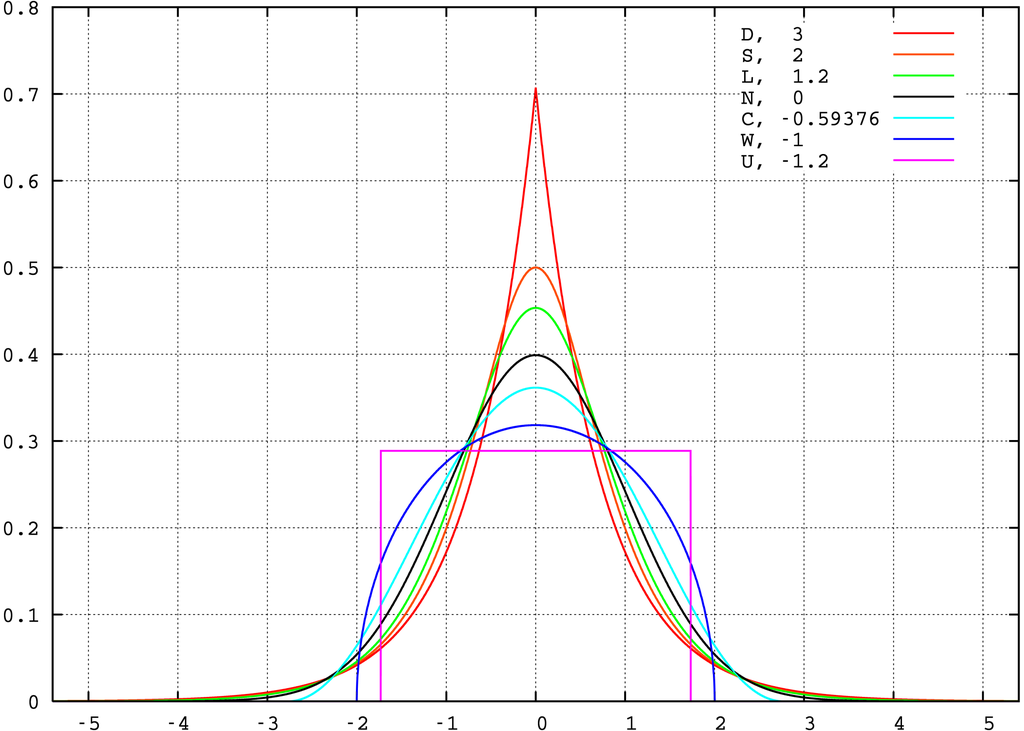
Key:
- Red, kurt 3, Laplace (D)ouble exponential distribution;
- Orange, kurt 2, hyperbolic (S)ecant distribution;
- Green, kurt 1.2, (L)ogistic distribution;
- Black, kurt 0, (N)ormal distribution;
- Cyan, kurt −0.593762…, raised (C)osine distribution;
- Blue, kurt −1, (W)igner semicircle distribution
- Magenta, kurt −1.2,
- (U)niform distribution.
Calculating Kurtosis.
Although kurtosis is a powerful statistical measure, there’s been no established consensus on the exact formula to use for its calculation. This means that which equation you opt for can be determined by your field of research, the software program in hand or even simply personal preference.
Therefore it pays off to stay informed and know exactly what definition/equation is being utilized beforehand.
For Minitab and SPSS, you can find the option in the “Descriptive Statistics” tab.
Kurtosis in Excel 2013
The “KURT” reported by Excel is actually the excess kurtotis.
There are two options in Excel for finding kurtosis: the KURT Function and the Data Analysis Toolpak.
Kurtosis Excel 2013: KURT function
- Type your data into columns in an Excel worksheet.
- Click a blank cell.
- Type =KURT(A1:A99) where A1:99 is the cell locations for your data.
Kurtosis Excel 2013: Data Analysis
- Click the “Data” tab and then click “Data Analysis.”
- Click “Descriptive Statistics” and then click “OK.”
- Click the Input Range box and then type the location for your data. For example, if you typed your data into cells A1 to A10, type “A1:A10” into that box
- Click the radio button for Rows or Columns, depending on how your data is laid out.
- Click the “Labels in first row” box if your data has column headers.
- Click the “Descriptive Statistics” check box.
- Select a location for your output. For example, click the “New Worksheet” radio button.
- Click “OK.”
Platykurtic
Platykurtic distributions are far from ‘normal’, featuring a negative kurtosis and significantly thinner tails than the standard bell curve. In striking contrast, leptokuritc distributions have an excess of positive kurtosis with much fuller tails- clearly visible when compared to a normal distribution.
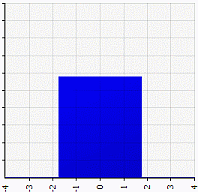
An example of a very platykurtic distribution is the uniform distribution.
Leptokurtic
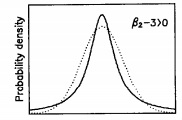
A leptokurtic distribution has excess positive kurtosis, where the kurtosis is greater than 3. The tails are fatter than the normal distribution. The following illustration [1] shows a leptokurtic distribution along with a normal distribution (dotted line).
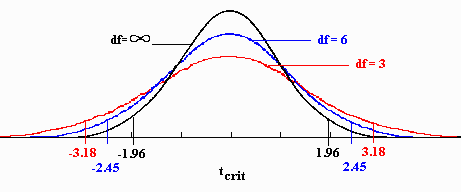
The Leptokurtic T-Test
The T distribution is an example of a leptokurtic distribution. It has fatter tails than the normal (you can also look at the first image above to see the fatter tails). Therefore, the critical values in a Student’s t-test will be larger than the critical values from a z-test.
Why Does Kurtosis Matter?
Kurtosis is important because it tells us something about how our data behaves in different situations. For example, when calculating risk for investments or insurance policies, having an understanding of this concept can help us better assess potential losses and rewards associated with those investments or policies.
Similarly, understanding the topic can provide insight into how errors propagate through systems like neural networks or machine learning algorithms when applied to real-world problems such as recognizing patterns in images or predicting future events based on past data points. This can provide crucial information needed for making informed decisions about investing money and developing these systems for optimal performance and accuracy.
Kurtosis also has real life applications in the world of economics. Fund managers usually focus on risks and returns, so it’s helpful to know if an investment is lepto- or platy-kurtic. According to stock trader and analyst Michael Harris, a leptokurtic return means that risks are coming from outlier events. This would be a stock for investors willing to take extreme risks. For example, real estate (with a kurt of 8.75) and High Yield US bonds (8.63) are high risk investments while Investment grade US bonds (1.06) and Small cap US stocks (1.08) would be considered safer investments.
If you’re looking for a high risk/high reward investment, kurtosis may be your answer. Fund managers typically examine risks and returns when it comes to investments, taking into account whether something is lepto- or platy-kurtic; in other words if the return includes extreme outliers events that can cause more dramatic swings in value. For instance real estate (with a Kurt of 8.75) and High Yield US bonds (8.63), constitute higher risk investments while Investment grade US Bonds (1.06) and Small cap stocks 1(0).08 are deemed safer options – thus offering lower potential rewards but less volatility as well.
The Peakedness Debate
The question of what kurtosis describes exactly — peakedness of a distribution or an indication of how much data is in the tails, is up for debate. Many articles have been published both advocating its interpretation as ’peakedness’ of a distributions and opposing it.
See Crack [2] for a discussion of kurtosis that rebuts some recent research in the area and “gets to the root” of what the term means. In the author’s opinion, Kurtosis is both peakedness and fat tails relative to a normal distribution. Statistician Peter Westfall [3] is firmly on the tail side:
“The incorrect notion that kurtosis somehow measures “peakedness” (flatness, pointiness or modality) of a distribution is remarkably persistent, despite attempts by statisticians to set the record straight. ”
Fiori & Zenga [4] offer a neutral historical review.
References
- http://www.columbia.edu/~ld208/psymeth97.pdf
- CRACK, T. (2022). Foundations for Scientific Investing: Capital Markets Intuition and Critical Thinking Skills. Timothy F. Crack, 11th ed.
- WESTFALL, P. H. (2014). Kurtosis as peakedness, 1905–2014. R.I.P. The American Statistician 68, 191–195.
- FIORI, A. M. & ZENGA, M. (2009). Karl Pearson and the origin of… International Statistical Review 77, 40–50 Aldrich, E. (2014). Moments. Retrieved December 9, 2017 from: https://people.ucsc.edu/~ealdrich/Teaching/Econ114/LectureNotes/moments.html DeCarlo, L. 1997.
Check out our YouTube channel for more stats help and tips!