P Value Definition
Watch the video for an overview of the p-value, or read on below.

Can’t see the video? Click here to watch it on YouTube.
A p value is used in hypothesis testing to help you support or reject the null hypothesis. The p value is the evidence against a null hypothesis. The smaller the p-value, the stronger the evidence that you should reject the null hypothesis.
P values are expressed as decimals although it may be easier to understand what they are if you convert them to a percentage. For example, a p value of 0.0254 is 2.54%. This means there is a 2.54% chance your results could be random (i.e. happened by chance). That’s pretty tiny. On the other hand, a large p-value of .9(90%) means your results have a 90% probability of being completely random and not due to anything in your experiment. Therefore, the smaller the p-value, the more important (“significant“) your results.
When you run a hypothesis test, you compare the p value from your test to the alpha level you selected when you ran the test. Alpha levels can also be written as percentages.
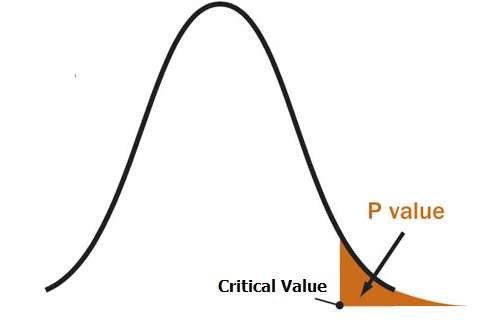
Graphically, the p value is the area in the tail of a probability distribution. It’s calculated when you run hypothesis test and is the area to the right of the test statistic (if you’re running a two-tailed test, it’s the area to the left and to the right).
P Value vs Alpha level
Alpha levels are controlled by the researcher and are related to confidence levels. You get an alpha level by subtracting your confidence level from 100%. For example, if you want to be 98 percent confident in your research, the alpha level would be 2% (100% – 98%). When you run the hypothesis test, the test will give you a value for p. Compare that value to your chosen alpha level. For example, let’s say you chose an alpha level of 5% (0.05). If the results from the test give you:
- A small p (≤ 0.05), reject the null hypothesis. This is strong evidence that the null hypothesis is invalid.
- A large p (> 0.05) means the alternate hypothesis is weak, so you do not reject the null.
P Values and Critical Values
The p value is just one piece of information you can use when deciding if your null hypothesis is true or not. You can use other values given by your test to help you decide. For example, if you run an f test two sample for variances in Excel, you’ll get a p value, an f-critical value and a f-value.
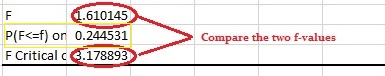
In the above image, the results from the f-test show a large p value (.244531, or 24.4531%), so you would not reject the null. However, there’s also another way you can decide: compare your f-value with your f-critical value. If the f-critical value is smaller than the f-value, you should reject the null hypothesis. In this particular test, the p value and the f-critical values are both very large so you do not have enough evidence to reject the null.
What if I Don’t Have an Alpha Level?
In an ideal world, you’ll have an alpha level. But if you do not, you can still use the following rough guidelines in deciding whether to support or reject the null hypothesis:
- If p > .10 → “not significant”
- If p ≤ .10 → “marginally significant”
- If p ≤ .05 → “significant”
- If p ≤ .01 → “highly significant.”
How to Calculate a P Value on the TI 83
Example question:The average wait time to see an E.R. doctor is said to be 150 minutes. You think the wait time is actually less. You take a random sample of 30 people and find their average wait is 148 minutes with a standard deviation of 5 minutes. Assume the distribution is normal. Find the p value for this test.
- Press STAT then arrow over to TESTS.
- Press ENTER for Z-Test.
- Arrow over to Stats. Press ENTER.
- Arrow down to μ0 and type 150. This is our null hypothesis mean.
- Arrow down to σ. Type in your std dev: 5.
- Arrow down to xbar. Type in your sample mean: 148.
- Arrow down to n. Type in your sample size: 30.
- Arrow to <μ0 for a left tail test. Press ENTER.
- Arrow down to Calculate. Press ENTER. P is given as .014, or about 1%.
The probability that you would get a sample mean of 148 minutes is tiny, so you should reject the null hypothesis.
Note: If you don’t want to run a test, you could also use the TI 83 NormCDF function to get the area (which is the same thing as the probability value).
References
Dodge, Y. (2008). The Concise Encyclopedia of Statistics. Springer.
Gonick, L. (1993). The Cartoon Guide to Statistics. HarperPerennial.