Calculus Problem solving > Draw graph of derivative
There are two types of problems that might ask you to draw the graph of a derivative: given a function, or not given a function. You can use the same procedure for both types of problems. You don’t need to know any calculus, but you have to sketch a tangent line and calculate “rise over run” to find the slope.
If you’re given an equation, you’ll need to sketch the graph of the function first (start at Step 1 below). If you’re only given a graph of a function, skip to Step 3.
Draw Graph of Derivative: Example
The derivative is the slope of the tangent line at a particular point on the graph. To draw the graph of the derivative, first you need to draw the graph of the function. Let’s say you were given the following equation: f(x) = -x2 + 3.
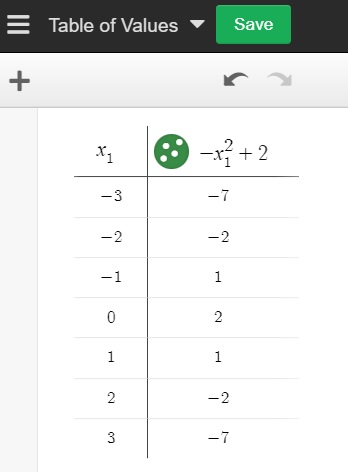
Step 1: Make a table of values. A good place to start is to find a few values centered around the origin (0). Choose a few x-values then plug those into your equation to get the corresponding y-values. I used Desmos.com to create this table:
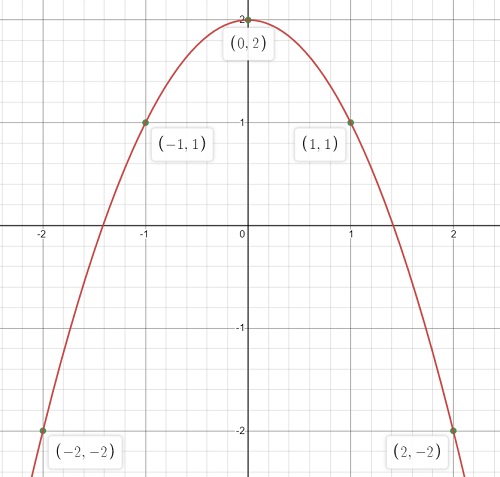
Step 2: Sketch your graph by plotting a few points (from Step 1) and connecting them with curved lines (for a polynomial function) or straight lines (for a linear function or absolute value function). We have a polynomial function here, so I’ll use smooth curves to connect the points:
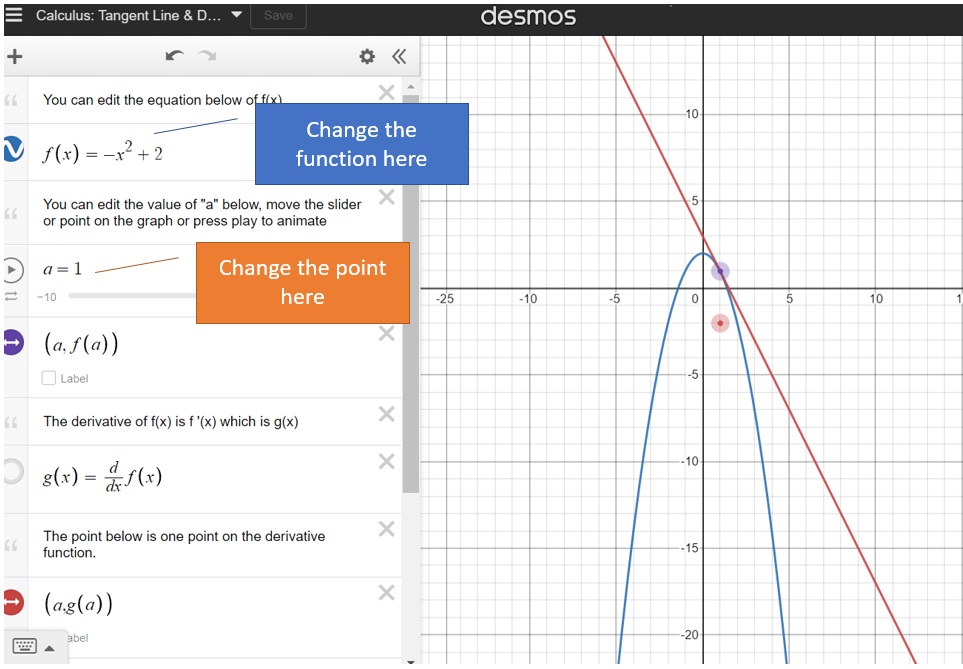
Step 3: Sketch tangent lines by your points. A tangent line is a line that touches a graph at only one point and is practically parallel to the graph at that point. If you aren’t comfortable with drawing tangent lines, this Desmos tool will give you some great practice. You can change the function and it will sketch the tangent line for any point “a” on the graph:
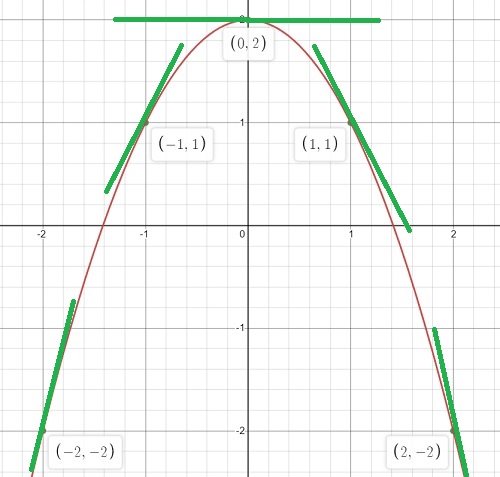
Here’s the graph from Step 2, with tangent lines added at 5 points (from -2 to 2):
Step 4: Use “Rise over run” to calculate the slope of each tangent line. This image shows that rise over run for the tangent line at point (2, 2) is 4 / 1, which gives a slope of 4:
Calculating rise over run for all five points gives us:
- (-2, 2) = -4
- (-1, 1) = -2
- (0, 0) = 0
- (1, 1) = 2
- (2, 4) = 4
These are your new y-values.
Step 5: Create new pairs of points using your chosen x-values (in this example, that’s -2, -1, 0, 1, and 2) and the new y-values from Step 4:
- (-2,-4)
- (-1,-2)
- (0, 0)
- (1, 2)
- (2, 4)
Step 6: Plot the new points (from Step 5):
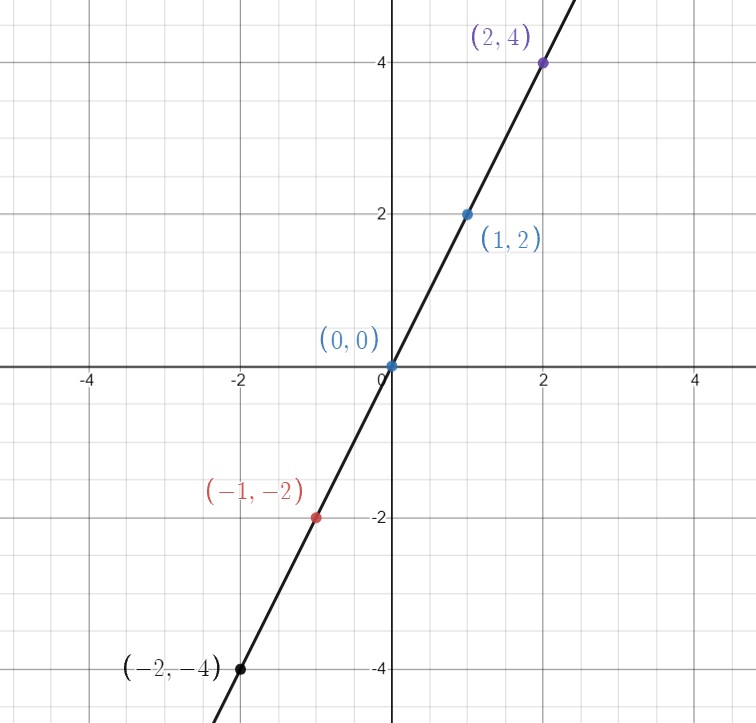
This is the solution to draw the graph of a derivative.