- What is the Sample Variance?
- Sample Variance Formula
- Calculating Sample Variance
- Sample variance in Excel
- What is the Sample Variance Used For?
- Sample standard deviation vs. sample variance
- Is variance a reliable measure of variability?
What is the Sample Variance?
The sample variance, s², is used to calculate how varied a sample is. A sample is a part of a whole population.
For instance, if you are measuring the weights of American people, it wouldn’t be feasible (from either a time or a monetary standpoint) for you to measure the weights of every person in the population. Instead, you can take a sample of perhaps 1000 people, and use that to estimate the actual weights of the whole population. The variance helps to determine how spread out the weights are.
Watch the video for an example of how to find the sample variance:
Definition of Sample Variance

The variance is mathematically defined as the average of the squared differences from the mean. But what does that actually mean in English? In order to understand what you are calculating with the variance, break it down into steps:
- Step 1: Calculate the mean (the average weight).
- Step 2: Subtract the mean and square the result.
- Step 3: Work out the average of those differences.
- Use the sample variance and standard deviation calculator
- Or see: how to calculate the sample variance (by hand).
Sample Variance Formula
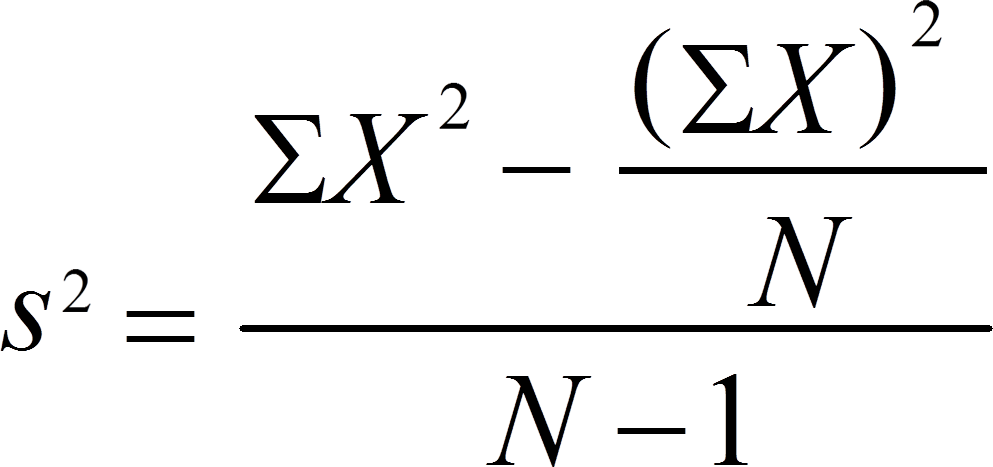
If you’re finding the sample variance by hand, the “usual” formula you’re given in textbooks is:

However, if you’re working the formula by hand, it can be a bit cumbersome, especially because of the summation notation (Σ). An alternative version is the computational formula, which can be a little easier to work:
Why are Squares Used in the Sample Variance Formula?
The reason the values are squares (instead of say, cubes) is related to the Pythagorean Theorem and orthogonality (which is another way of saying “independent”). For two independent random variables X and Y, we have:
Var (X + Y) = Var(X) + Var(Y)
which is analogous to the following:
If two triangle side lengths a and b are orthogonal, the length of the hypotenuse is √(a2 + b2) [1].
Calculating Sample Variance
The variance formula can be tricky to use—especially if you are rusty on order of operations. By far the easiest way to find the variance is to use an online standard deviation calculator. You can also use it to check your work. Have to work the formula by hand? Read on!
How to Find the Sample Variance by Hand
Click for examples:
- Example 1: Variance (computational formula).
- Example 2: Standard Deviation.
- Example 3 (computational formula, both).
- Example 4 (usual formula, both).
- Example 5 (computational formula, both).
- How to Find the Sample Variance in Excel
Variance Example 1
Question: Find the variance for the following set of data representing trees in California (heights in feet): 3, 21, 98, 203, 17, 9
- Add up the numbers in your given data set. 3 + 21 + 98 + 203 + 17 + 9 = 351
- Square your answer: 351 × 351 = 123,201
- Divide by the number of items. We have 6 items in our example so: 123,201 / 6 = 20,533.5. Set this number aside for a moment.
- Take your set of original numbers from Step 1, and square them individually this time: 3 × 3 + 21 × 21 + 98 × 98 + 203 × 203 + 17 × 17 + 9 × 9
- Add those numbers (the squares) together: 9 + 441 + 9604 + 41209 + 289 + 81 = 51,633
- Subtract the amount in Step 3 from the amount in Step 5. 51,633 – 20,533.5 = 31,099.5. Set this number aside for a moment.
- Subtract 1 from the number of items in your data set. For our example: 6 – 1 = 5
- Divide the number in Step 4 by the number in Step 5. This gives you the variance: 31,099.5 / 5 = 6,219.9.
Standard Deviation Example 2
Take the square root of your answer from Step 8. This gives you the standard deviation:
√6,219.9 = 78.86634
That’s it!
Important note: The standard deviation formula is slightly different for populations and samples (a portion of the population). If you have a population, you’ll be dividing by “n” (the number of items in your data set). However, if you have a sample (which is the case for most statistics questions you’ll get in class!) you’ll need to divide by n-1. For why n-1 is used, see: Bessel’s Correction.
Like the explanation? Check out the Practically Cheating Statistics Handbook, which has hundreds more step-by-step solutions, just like this one!
Example 3
Example question: Your paychecks for the last few weeks are: $600, $470, $430, $300 and $170. What is the standard deviation?
- Add up all of the numbers: 170 + 300 + 430 + 470 + 600 = 1970
- Square the total 1970 x 1970 = 3880900
- Divide Step 2 by the number of items in the data set 3880900 / 5 = 776180
- Take your set of original numbers from step 1, and square them individually this time. Then add them all up: (170 x 170) + (300 x 300) + (430 x 430) + (470 x 470) + (600 x 600) = 884700
- Subtract the amount in step 3 from the amount in step 4: 884700 – 776180 = 108520
- Subtract 1 from the number of items in the data set: 5 – 1 = 4
- Divide the number in step 4 by the number in step 5: 108520 / 4 = 27130. This is my Variance!
- Take the square root of the number from step 7 (the Variance): √(27130) = 164.7118696390761
This is my Standard Deviation!
Example 4
This example uses the same formula, it’s just a slightly different way of working it.
Example question: You survey households in your area to find the average rent they are paying. Find the standard deviation from the following data: $1550, $1700, $900, $850, $1000, $950.
- Find the mean: ($1550 + $1700 + $900 + $850 + $1000 + $950)/6 = $1158.33
- Subtract the mean from each value. This gives you the differences:
- $1550 – $1158.33 = $391.67
- $1700 – $1158.33 = $541.67
- $900 – $1158.33 = -$258.33
- $850 – $1158.33 = -$308.33
- $1000 – $1158.33 = $158.33
- $950 – $1158.33 = $208.33
- Square the differences you found in Step 3:
- $391.672 = 153405.3889
- $541.672 = 293406.3889
- -$258.332 = 66734.3889
- -$308.332 = 95067.3889
- $158.332 = 25068.3889
- $208.332 = 43401.3889
- Add up all of the squares you found in Step 3 and divide by 5 (which is 6 – 1):
(153405.3889 + 293406.3889 + 66734.3889 + 95067.3889 + 25068.3889 + 43401.3889) / 5 = 135416.66668 - Find the square root of the number you found in Step 4 (the variance): 135416.66668 = 367.99
The standard deviation is 367.99.
Find Variance Example 5
Example Question: Find sample variance / standard deviation for the following data set: 1245, 1255, 1654, 1547, 1787, 1989, 1878, 2011, 2145, 2545, 2656.
- Add up all of the numbers in your data set: 1245 + 1255 + 1547 + 1654 + 1787 + 1878 + 1989 + 2011 + 2145 + 2545 + 2656 = 20712
- Square the number you found in Step 1: 20712 x 20712 = 428986944
- Divide by the number of items in your data set. 428986944 / 11 = 38998813.09090909. Set this number aside for a moment.
- Square all of the numbers in your data set and then add them together. (1245 x 1245) + (1255 x 1255) + (1547 x 1547) + (1654 x 1654) + (1787 x 1787) + (1878 x 1878) + (1989 x 1989) + (2011 x 2011) + (2145 x 2145) + (2545 x 2545) + (2656 x 2656) = 41106856
- Subtract the number you calculated in Step 3 from the number you calculated in Step 4: 41106856 – 38998813.09090909 = 2108042.9090909064
- Subtract 1 from the number of items in your data set: 11 – 1 = 10.
- Divide the number you calculated in step 5 by the number you calculated in step 6: 2108042.9090909064 / 10 = 210804.29090909063. This is the Variance.
- Take the square root of Step 6 to find the standard deviation: √ 210804.29090909063 = 459.13.
That’s it!
How to Find the Sample Variance in Excel
Contents:
- How to Find the Sample Variance in Excel 2013 and up.
- How to Find the Sample Variance in Excel 2007-2010.
Sample Variance in Excel (2013 and up)
Sample Variance Excel 2013: Overview
 Excel gives you two options. If you haven’t already, be sure to load the Data analysis Toolpak (How to load the Data Analysis Toolpak). It’s a powerful tool that you’ll use over and over again in stats. If you don’t have the Toolpak (or don’t want to install it), your second option is to use the VAR function.
Sample Variance Excel 2013: Data Analysis Toolpak
- Click the “Data” tab and then click “Data Analysis.”
- Click “Descriptive Statistics” and then click “OK.”
- Click the Input Range box and then type the location for your data. For example, if you typed your data into cells A1 to A10, type “A1:A10” into that box
- Click the radio button for Rows or Columns, depending on how your data is laid out.
- Click the “Labels in first row” box if your data has column headers.
- Click the “Descriptive Statistics” check box.
- Select a location for your output. For example, click the “New Worksheet” radio button.
- Click “OK.”
Sample Variance Excel 2013: VAR Function
- Type your data into a single column.
- Click a blank cell.
- Type “=VAR(A1:A100)” where A1:A100 is the location of your data set (i.e. in cells A1 to A100). Press the “Enter” key to get the sample variance.
Sample Variance in Excel 2010
Sample variance in Excel 2007-2010 is calculated using the “Var” function. Read the steps below on how to calculate it.
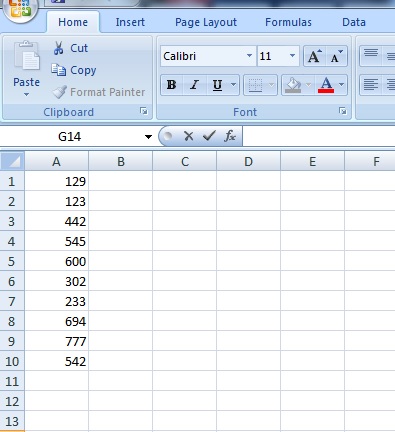
Example question: Find the sample variance in Excel 2007-2010 for the following sample data: 123, 129, 233, 302, 442, 542, 545, 600, 694, 777
Step 1: Type your data into a single column in an Excel worksheet. For this example, I typed “123, 129, 233, 302, 442, 542, 545, 600, 694, 777” into column A. Don’t leave any blank cells between your data.
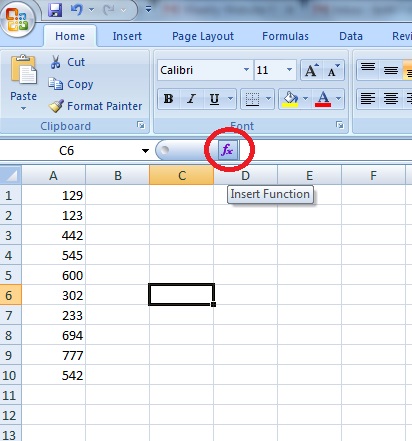
Step 2: Click any empty cell.
Step 3: Click the “Insert function” button on the toolbar. This opens the Insert Function dialog box.
Step 4: Type “Var” into the Search for a Function text box and then click “Go.” VAR should be highlighted in the function list.
Step 5: Click “OK.”
Step 6: Type the location of the sample data into the Number1 text box. This sample data was typed into cells A1 to A10, so I typed “A1:A10” into the text box. Make sure to separate the first and last cells by a colon (A1:A10).
Step 7: Click “OK.” Excel will return the sample variance in the cell you chose in Step 2. For this question, the variance of 123, 129, 233, 302, 442, 542, 545, 600, 694, 777 is 53800.46.
Tips:
- You can also access the VAR function from the “Formulas” tab in Excel. Click the “Formulas” tab and then click the “Insert Function” button on the far left of the toolbar. Continue from Step 4 above to calculate the variance.
- You don’t have to type your sample data into a worksheet. Technically, you could open the VAR function dialog box and then type your data into the Number1, Number2 etc. boxes. However, the advantage of typing the data directly into the worksheet is that you can perform more functions on your data (like standard deviation) if you need to.
Check out our YouTube channel for more Excel help and tips!
What is the sample variance used for?
While the variance is useful in a mathematical sense, it won’t actually give you any information that you can use. For example, if you take a sample population of weights, you might end up with a variance of 9801. That might leave you scratching your head about why you’re calculating it in the first place! The answer is, you can use the variance to figure out the standard deviation—a much better measure of how spread out your weights are. In order to get the standard deviation, take the square root of the sample variance:
√9801 = 99.
The standard deviation, in combination with the mean, will tell you what the majority of people weigh. For example, if your mean is 150 pounds and your standard deviation is 99 pounds, the majority of people weigh between 51 pounds (mean-99) and 249 pounds (mean+99).
Sample standard deviation vs. sample variance
The sample variance and sample standard deviation are both measures of how spread out the values in a sample are from the sample mean. However, they are calculated differently.
- To calculate the sample variance, find the average of the squared deviations from the mean.
- The sample standard deviation is the square root of the sample variance.
While the sample standard deviation is expressed in units of the original data, the sample variance is in squared units. The result is that the sample standard deviation is easier to interpret than the sample variance.
The sample standard deviation is perhaps the most popular measure of variability. The sample variance can be used in some cases, such as when the data is not normally distributed.
Is variance a reliable measure of variability?
Variance is a reliable way to measure variability, but it does have limitations. The primary advantage of the sample variance is that it’s relatively easy to calculate. It is a versatile measure applicable to various data sets.
However, one limitation is its lack of interpretability. The units of variance are squared, making it challenging to grasp its meaning. Another disadvantage is it’s sensitivity to outliers, which are data points significantly distant from the mean. Outliers can artificially inflate the variance.
Alternative measures of variability:
- Standard deviation: The square root of variance, offering greater interpretability.
- Interquartile range: The range between the first and third quartiles, representing the middle 50% of the data. Not sensitive to outliers.
- Range: The difference between the largest and smallest values, providing a simple measure of variability but limited sensitivity to the middle of the data set.
The selection of the most suitable variability measure depends on the specific data set and analysis goals.
References
- Kjos-Hanssen, B. (2019). Statistics for Calculus Students. Retrieved April 28, 2021 from: https://dspace.lib.hawaii.edu/bitstream/10790/4572/s4cs.pdf