Statistics Definitions > Goodness of Fit Tests
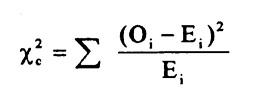
The goodness of fit test is it tells you if your sample data represents the data you would expect to find in the actual population. More specifically, it is used to test if sample data fits a distribution from a certain population (i.e. a population with a normal distribution or one with a Weibull distribution).
Goodness of fit tests commonly used in statistics are:
The chi-square test is the most common of the goodness of fit tests and is the one you’ll come across in AP statistics or elementary statistics. The chi square can be used for discrete distributions like the binomial distribution and the Poisson distribution, while the The Kolmogorov-Smirnov and Anderson-Darling goodness of fit tests can only be used for continuous distributions.
1. The Chi Square Goodness of Fit Test

Watch the video for an overview of the chi-square tests:
Two potential disadvantages of chi square are:
- The chi square test can only be used for data put into classes (bins). If you have non-binned data you’ll need to make a frequency table or histogram before performing the test.
- Another disadvantage of the chi-square test is that it requires a sufficient sample size in order for the chi-square approximation to be valid.
There is another type of chi-square test, called the chi-square test for independence. The two are sometimes confused but they are quite different.
- The chi-square test for independence compares two sets of data to see if there is a relationship.
- The chi-square Goodness of fit is to fit one categorical variable to a distribution.
Both tests use the chi-square statistic and distribution. For more information about calculating the chi square statistic, see:
The chi square test statistic (includes calculations): What is a chi square statistic?
Running the Test
Typically, this test is run using software. The null hypothesis for the chi-square goodness of fit test is that the data comes from a specified distribution. The alternate hypothesis is that the data does not come from a specified distribution.
To interpret the test, you’ll need to choose an alpha level (1%, 5% and 10% are common). The chi-square test will return a p-value. If the p-value is small (less than the significance level), you can reject the null hypothesis that the data comes from the specified distribution.
2. Kolmogorov-Smirnov
Although Kolmogorov-Smirnov is called a test for normality, it actually doesn’t tell you whether a particular sample likely came from a normal population. Instead, it will tell you when it is unlikely that you have a normal distribution. One advantage to this test is that it doesn’t make any assumptions about the distribution of data. A sample can be compared to a distribution using a one-sample K–S test or two-sample K–S test. The test is usually performed using software (like SPSS), because critical values have to be calculated for each distribution and finding the tables of critical values isn’t an easy task. The test is usually recommended for large samples over 2000. For smaller samples, use Shapiro-Wilk.
3. Anderson-Darling
The Anderson-Darling is a modification of Kolmogorov-Smirnov. It is more sensitive to deviations in a distribution’s tails. Like the Kolmogorov-Smirnov, this test will tell you when it is unlikely that you have a normal distribution and is normally run using statistical software.
Shapiro-Wilk
The Shapiro-Wilk test calculates a W value that will tell you if a random sample came from a normally distributed population. The test is recommended for samples up to n = 2000.
References
Beyer, W. H. CRC Standard Mathematical Tables, 31st ed. Boca Raton, FL: CRC Press, pp. 536 and 571, 2002.
Dodge, Y. (2008). The Concise Encyclopedia of Statistics. Springer.
Gonick, L. (1993). The Cartoon Guide to Statistics. HarperPerennial.
Vogt, W.P. (2005). Dictionary of Statistics & Methodology: A Nontechnical Guide for the Social Sciences. SAGE.