Statistics Definitions > Population in Statistics
What is a Population in Statistics?
A population in statistics is a whole group of people or objects from which samples are taken. It is the entire group that we are interested in, and it includes all of the members of the group [1].
A population is the opposite of a sample, which is a fraction or percentage of a group. For example, if you were interested in surveying dog owners to find out their preferred brand of dog food, the population would be all dog owners in the United States. It would be impractical to survey every single dog owner in the country, so you would instead take a sample of dog owners.
If you did manage to survey everyone in the population, it would be called a census. The U.S. Census is one example. In most cases, it’s impractical to survey everyone in a population due to time constraints or other factors. Imagine how long it would take you to call every dog owner in the U.S. to find out what their preferred brand of dog food was! In addition, sometimes people either don’t want to respond or forget to respond, leading to incomplete censuses. Incomplete censuses become samples by definition.
Sample vs. Population Examples
A population in statistics is any group that shares a common characteristic. These include people, things, places, or items. For example, all of the people alive in the world. At time of writing, that’s headed towards 8 billion [2]: 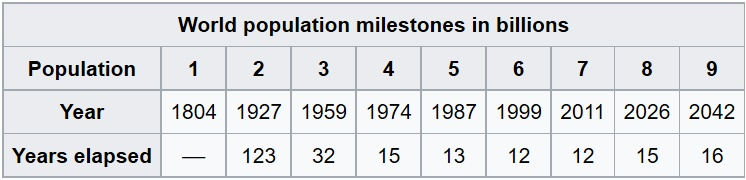 But a population in statistics doesn’t have to be people. For example, it could be a population of rabbits [3]:
 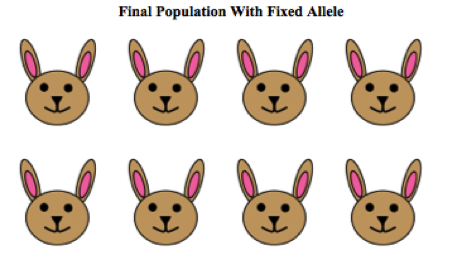 It could also be something inanimate, like balls or pixels on a computer screen, or golf balls in a bucket [4]:
Statistic vs. Parameter.
A parameter is data about an entire population. For example, if you want to find out which classes freshmen at a certain college were taking, you could ask everyone (perhaps via email) and it would be possible to get a parameter. Statistics are when you base your data from samples. For example, you might ask 20 percent of the freshman class what classes they are taking and use that data to make assumptions about what everyone is taking. If you base your results from a bit of the population, your results aren’t going to be perfect.
That’s where we talk about margins of error and confidence intervals in stats. In the candy store, you might be able to get a good feel for the candy line if you taste a few samples, but how confident are you that you can accurately say if your sampling wasn’t skewed? Perhaps the candy that day was extra fresh and tasted wonderful, or perhaps the flavors offered were ones that you didn’t care for. If you had the opportunity to taste test everything, you could offer an excellent opinion about the parameters of the candy line, but with sampling, all you have is a statistic.
How do you identify a population in statistics?
The trick to identifying a population is to look for the whole group. For example, the entire contents of an urn, everyone in a certain school, or every mouse in a particular field. What’s important is you’re looking for the entire group and not just a part of it. A few examples:
| Population | Sample |
|---|---|
| All adults in Florida | 1,000 adults in Florida |
| All students in a certain school | 100 students in the school |
| All employees at Twitter | 500 Twitter employees |
| All farmers in the Midwest | 100 farmers in the Midwest |
| All adults with high blood pressure | 100 adults with high blood pressure |
| All businesses that sell Fruit Loops | 500 businesses that sell Fruit Loops |
If you’re given a fraction, and that fraction is part of a larger group, that’s indicative of a sample and not a population. For example, a 20/100 prefer soap A is a sample of 20 people. But if 100% of people prefer soap B, that is indicative of a population.
In research, the term ‘population’ has different meanings, depending on what you’re studying. In general, it refers to all individuals or objects that a study focuses on. This could focus on demographic traits, geographical setting, organizational associations, or behavioral attributes.
- Demographic Features: Populations have demographic features such as age, gender, race, and ethnicity.
- Geographical Area: Populations can be divided up by geographical location, such as Southeast, West, North, etc..
- Organizational Association: Population members are often associated with a particular organization. For example, trade groups, Scouts, or fraternities.
- Behavioral Traits: Populations can be distinguished by behavioral traits. For example, people who smoke, people who buy cookies, or people who snore.
How to define a population in research, with examples
To define a population in statistics for a research study, ask two questions:
- Who or what is the group of interest for your study?
- Can data be gathered from each and every member or item within this group?
If you can identify the group and get data from every member, then you have identified your population.
For example, if you’re trying to find the average height of people in France, the population would be every person in the whole country. In this case, it’s not workable to gather data from every member of this group. You would need to use a sample instead — a smaller segment of the population.
Several illustrations of how researchers may define a population:
- A research on the influence of a new medicine on hypertension might consider all adults suffering from high blood pressure as its population.
- A study investigating climate change’s effect on agricultural productivity might identify its population as all farmers in a specific area.
- Research examining the efficiency of a novel teaching approach might regard all students in a certain school district as its population.
- An investigation into the frequency of a certain disease might mark its population as all inhabitants of a specified country.
Sometimes, it might be impractical to gather data from each member of the population. In such scenarios, researchers might resort to a sample. Generally, researchers aim for samples that are sufficiently large and representative, enabling them to draw valid conclusions about the population.
A few examples of how research might use samples:
- A researcher could conduct a survey on a 1,000-adult sample to gauge the percentage of adults favoring a certain policy.
- A clinical trial might be carried out on a 100-patient sample to test a new drug’s efficacy.
- A survey might be conducted on a 500-business sample to evaluate the impact of new regulations.
- A census might be carried out on a sample representing 10% of a country’s households to estimate the population size.
Why Populations are Important
Populations are important because they allow us to make inferences — educated guesses — about a larger group based on information gathered from a smaller group (i.e., the sample). This process of making inferences about a population based on information from a sample is called statistical inference. Statistical inference allows us to make predictions about populations based on data from samples. For example, if we surveyed a sample of 100 dog owners and found that 60% of them preferred Brand A dog food, we could then infer that 60% of all dog owners in the United States prefer Brand A dog food.
There are two main types of statistical inferences: point estimates and confidence intervals.
- Point estimates are single values that are used to estimate population parameters (such as means, proportions, and variances). For example, if we wanted to estimate the mean age of all dog owners in the United States, we could use the point estimate provided by our sample mean age.
- Confidence intervals are used when we want to estimate an interval or range within which the true parameter value falls with some degree of confidence (usually 95%). So using our previous example, we could say with 95% confidence that the true mean age of all dog owners in the United States falls between x and y years old.
The reason that populations can be used to make inferences is that they represent the entire group of individuals or items that are under investigation. This implies that any deductions made from the statistical analysis of a sample from that population can be extrapolated to the whole population.
For example, to calculate the mean height of people living in the United States, you would ideally calculate the population mean. This would provide a reliable estimate of the average height of all individuals in the United States.
But calculating the mean from the entire population might not be feasible. In such scenarios, a sample can serve as an estimate of the population. A sample will never perfectly mirror the population, because they are just a fraction of the population and so may not be representative of the whole group. But in real life, we usually can’t count every population member, so we have to work with samples.
References
- Chumney, F. Introduction to Statistics.
- Timeshifter, CC BY-SA 4.0, via Wikimedia Commons
- Klcater, CC BY-SA 4.0, via Wikimedia Commons
- kallerna, CC BY-SA 3.0 <https://creativecommons.org/licenses/by-sa/3.0>, via Wikimedia Commons