Statistics Definitions >
Continuous variables can take on an infinite number of variables. For example, you could have a random variable Y that represents possible weights:

The probability distribution function shown above shows all possible values for Y, which for this case, has an infinite amount of possibilities. For example, the random variable Y could equal 180 pounds, 151.2 pounds or 201.9999999999 pounds.
We can use probability distribution functions to answer a question like:
What is the probability that a person will weigh between 150 lbs and 250 lbs?
Written in notation, the question becomes:
P(150 < Y < 250)
To answer the question, shade the area on the graph:
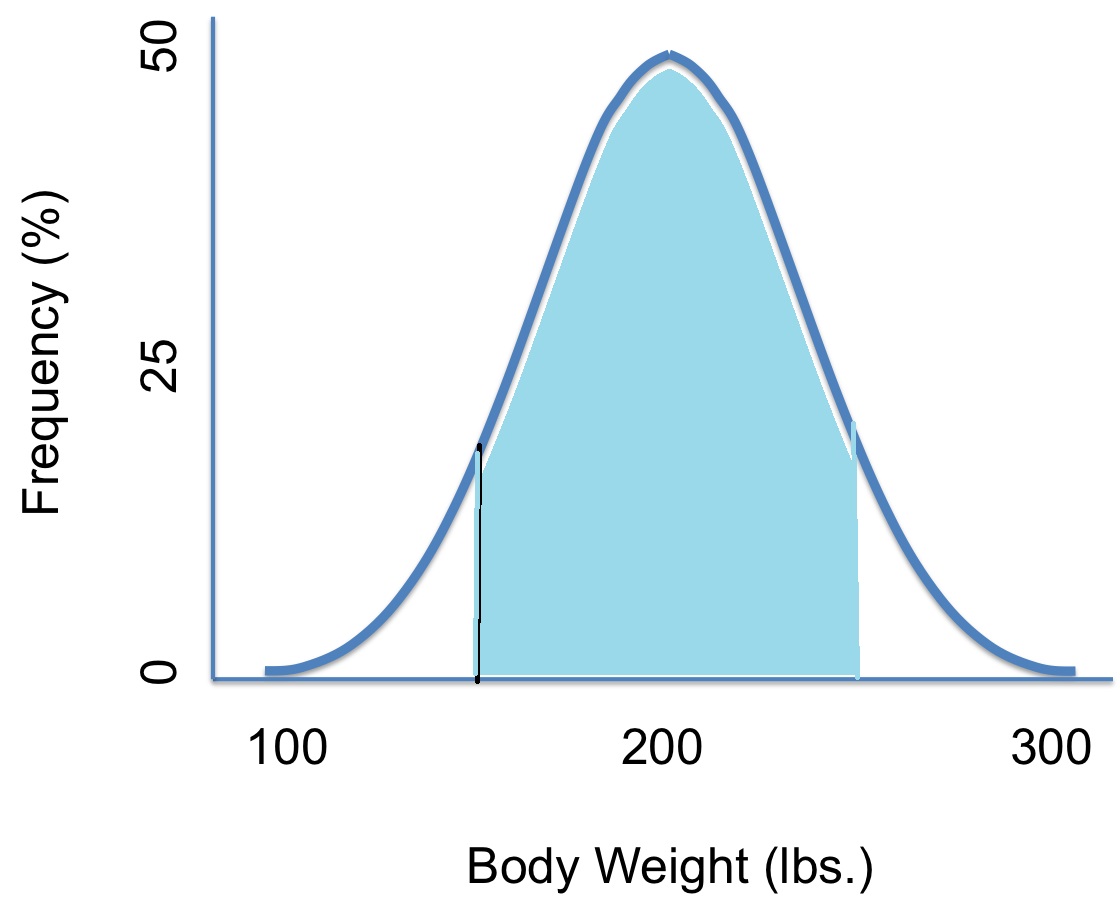
Then approximate the area. From looking at the shaded area, it looks like it’s about 75 percent.
So, P(150 < Y < 250) = 75%.
You can use the same technique for figuring out the probability for less than or greater than a certain number. Just shade in the area to the right of the number (for greater than) or to the left of the number (for less than).
Use Caution When Reading Probability Distribution Function Graphs!
Probability functions are great for figuring out intervals (because then you have an area to measure). However, you have to use a little caution with reading probability distribution function graphs, especially when it comes to exact numbers. For example: What about the probability any person will weigh exactly 180lbs? Written in notation, the question would be:
P(Y=180).
Looking at the graph, you might think that the probability of a person weighing 180lbs is about 50%, But that doesn’t make sense, right? That half of all people weigh exactly 180lbs! What you have to think about is that someone could weigh 180 pounds or they could weigh 180 pounds and a fraction of an ounce either way. they could weigh 180.00001 pounds or they could weight 179.999999999 pounds. In fact, the odds of someone weighing exactly 180 pounds is so tiny it’s practically zero.
Another way to look at this is that if you drew the “area” for a question like this, it would actually just be a line. And a line has zero area!
Note: We used a normal distribution in the above example, but probability distribution functions can be any shape, including uniform distributions and exponential distributions.
TI 83 NormalPDF Function
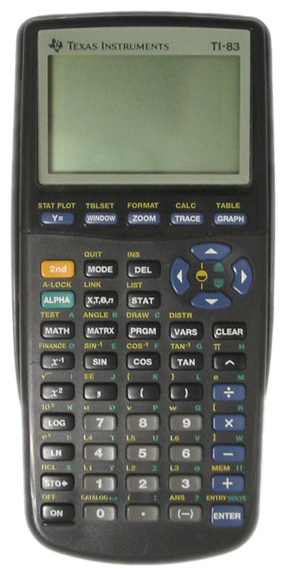
The TI 83 normalPDF function, accessible from the DISTR menu will calculate the normal probability distribution function, given the mean μ and standard deviation σ. The function doesn’t actually give you a probability, because the normal distribution curve is continuous. However, you can use it to plot a bell curve and to find x-values and y-values for points on the curve.
For other normal distribution commands on the TI 83 (like the TI 83 normalCDF), visit the TI 83 for statistics menu.
TI 83 NormalPDF function: Steps
Sample Problem: Graph a bell curve on the TI 83 calculator with a mean of 100 and standard deviation of 15. Use the NormalPDF function.
Step 1: Press Y=.
Step 2: Press 2nd VARS 1 to get “normalPDF.”
Step 3: Press the X,T,θ,n button, then the mean (100), then the standard deviation, 15. Close the parentheses.
Step 4: Press WINDOW.
Step 5: Change the window values to the following (type the values into the relative boxes):
Xmin=100-3*15
Xmax=100+3*15
Xscl=1
Ymin=0
Ymax=normalpdf(100,100,15)
Notes:
- The x-min/x-max is set to the mean, minus/plus three standard deviations, as this is a bell curve so +/- 3 standard deviations will show the entire curve.
- Ymax uses the normalpdf function to determine the maximum y-value at the mean (the peak of the curve)
Step 6: Press GRAPH. The TI 83 will graph a normal distribution curve on your screen.
Step 7: Press TRACE and then type in any number to find the y-value. For this example, type 80 and then press ENTER.
That’s how to use the TI 83 NormalPDF!
Tip: A mean of zero and a standard deviation of are the default values for a normal distribution on the calculator, if you don’t set those values.
Lost your guidebook? Download a new one here from the TI website.
Check out our Youtube channel for more stats help and tips!