Statistics Definitions > What is Statistical Significance?
Statistical Significance is a way to tell you if your test results are solid. Statistics isn’t an exact science. In fact, you can think of stats as very finely tuned guesswork. As stats is guesswork, we need to know how close our “guess” is. That’s where significance comes in.
What is Statistical Significance: Overview
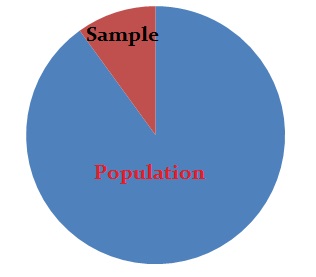
Stats is all about taking a piece of the population and making a guess about what that population’s behavior might be like. If you were working with parameters (parameter vs. statistic explanation), there would be no need for guesswork; You’d have all the data. In real life getting all of the data can be costly, time-consuming, or impossible.
For example, Gallup Polls uses stats to estimate who will win the next election. Drug manufacturers use stats to estimate how many people might have side effect from their drugs. And businesses use stats to forecast sales figures for the future.
What is Statistical Significance a Measure of?
Statistical significance is a measure of whether your research findings are meaningful. More specifically, it’s whether your stat closely matches what value you would expect to find in an entire population. As a simple example, let’s say you worked for a polling company and asked 120 people how they were going to vote in the next election. You would want your report to reflect everyone in the country, right? In other words, you want your report to have significant findings. How is “significance” measured? With a few calculations.
In order to test for statistical significance, perform these steps:
- Decide on an alpha level. An alpha level is the error rate you are willing to work with (usually 5% or less).
- Conduct your research. For example, conduct a poll or collect data from an experiment.
- Calculate your statistic. A statistic is just a piece of information about your sample, like a mean, mode or median.
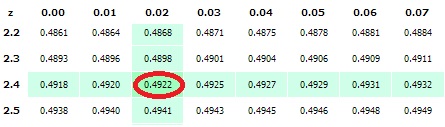
- Compare the statistic you calculated in Step 3 with a statistic from a statistical table.
Need help choosing a test? Check out our tutoring page!
There are many different types of tables you can use to figure out if your data has statistical significance or not. For more on hypothesis testing, see our hypothesis Testing index.
The Limited Meaning of Statistical Significance
When our sample statistic is outside of our 95% confidence interval, we reject the Null Hypothesis and call the result statistically significant. What does “statistically significant” mean? What does it tell us? At first, many people think that a statistically significant result using a 95% confidence interval tells them that there is a 95% chance they’re correct and a 5% chance they’re incorrect. But, unfortunately, that’s not what it means. Its meaning is much more limited. It only tells us that there is a 95% chance we’re correct and a 5% chance we’re incorrect when the Null Hypothesis is true. It’s on this basis that we reject the Null Hypothesis.
The meaning of statistical significance is limited in another way as well. Many people think, at first, that statistical significance tells them that the results must have meaningful real-world implications, that the results are practically significant. But, unfortunately, that’s not what it means either. The term significant is qualified with the term statistically. It doesn’t mean generally significant or practically significant or meaningfully significant.
To illustrate, let’s look at three examples of statistical significance. All involve calculating the 95% interval surrounding .5. They involve sample sizes of 100, 1000, and 10,000.
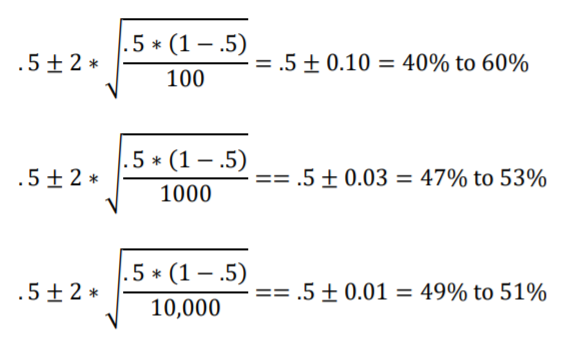
The 95% interval narrows as sample size increases. At some point the 95% interval will narrow to effectively nothing. In the case here of a sample size of 10,000 the interval is very narrow. The margin of error is only 0.01, or 1%. While a sample size of ten thousand may seem ridiculously large, in the modern age of digitized “big data” it actually isn’t. Regardless, the main point remains that with large enough sample sizes we can make nearly any result statistically significant.
So, if we had a sample of ten thousand and our sample percentage was 51.1% what would we infer? Well, we would reject the Null Hypothesis that the population is 50% in favor, and we would call the result statistically significant. Because it is. But what about practical significance? Is 51.1% meaningfully different from 50% in terms of its practical implications? Maybe, maybe not.
Statistical significance is important when assessing the results of statistical analysis, but you also need to look at the actual statistic values involved and decide whether they are practically significant, with meaningful real-world implications.
And while we do want to have sample sizes large enough to avoid undue risk of Type II Error, we also have to be wary when using sample sizes so large that negligible results have statistical significance. Here’s an example of that: A study found that a certain dietary supplement lowered the risk of getting a certain minor ailment from 2 in a 1000 (0.2%) down to 1 in a 1000 (0.1%). The sample size of the study was 30,000, so the difference between 0.2% and 0.1% is statistically significant (at 95% confidence). That gives a relative risk difference of 50% (0.2% – 0.1%)/.2%) but an absolute risk difference of only 0.1% (0.2% – 0.1%). Advertisements for the supplement highlighted the facts that the supplement’s positive effect was statistically significant and that the supplement reduced the risk of getting the ailment by 50%, but the advertisements did not mention that the absolute risk reduction was only 0.1%. Many people would find that misleading. And many people would consider an absolute risk difference of 0.1% to be negligible and practically insignificant.
Bottom line: You definitely want to know both the relative and absolute differences in order to better assess practical significance.
The Vioxx Scandal: How Significant is “Significant?”
Just over a decade ago, I had a rare disorder that affected my chest cartilage, called Tietze’s Syndrome. Tietze’s syndrome is an inflammation of the costal cartilage, it’s extremely painful, and the treatment at the time, the “miracle drug” from rheumatism of any kind, was a little pill called Vioxx. There was one slight problem with Vioxx. The manufacturer, Merck, used statistics to hide the fact that the drug had a minor side effect—it caused heart attacks. Thankfully, I wasn’t one of the unlucky ones.
Vioxx is a type of Non Steroidal Anti-Inflammatory Drug (NSAID), similar to aspirin or ibuprofen. The manufacturer, Merck, spent millions (160 million in 2000) in direct-to-consumer advertising for the drug. The drug was approved by the FDA in 1999 and withdrawn in 2004 after a slew of legal suits claimed the drug caused 23,800 cardiovascular events (including heart attacks) and a 2004 study (APPROVe) that found a statistically significant excess of cardiovascular events in Vioxx patients compared to placebo patients.
The Vioxx Scandal: What happened?
So what happened? How could a drug have statistical significance, get approved by the FDA, and put out to market if the drug was unsafe? The answer is that when the original studies about the drug were published, several of the Merck authors neglected to include three myocardial infarctions (heart attacks) in the final revision of the paper. They knew about the heart attacks, but also knew that including those three cases would make it statistically significant enough that the drug would not be approved. Three cases washed under the carpet were enough to turn an event from a statistically insignificant one (i.e. the drug got approved) to a significant one (the drug would not have got approved).
I can only imagine what went on at Merck, and the pressure these scientists had to “forget” those three cases after Merck had spent millions on development (not to mention the billions they were going to get from sales). Most likely, the scientists (or their bosses) didn’t understand the meaning of statistically significant, because I can’t imagine they thought that hiding three cases in a sample would lead to tens of thousands of heart attacks in the population.
References
Gonick, L. (1993). The Cartoon Guide to Statistics. HarperPerennial.
Kotz, S.; et al., eds. (2006), Encyclopedia of Statistical Sciences, Wiley.
Krumholz et al. (2007). What have we learned from Vioxx? BMJ. 2007 Jan 20; 334(7585): 120–123.
References
J.E. Kotteman. Statistical Analysis Illustrated – Foundations . Published via Copyleft. You are free to copy and distribute the content of this PDF.