Contents (click to go to the section):
- Sample Mean Symbol
- How to Find the Sample Mean
- Variance of the sampling distribution of the sample mean
- Calculate Standard Error for the Sample Mean
Watch the video for an example of how to find the sample mean:
Sample Mean Symbol and Definition
The sample mean symbol is x̄, pronounced “x bar”.
The sample mean is an average value found in a sample.

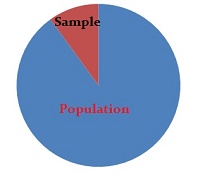
A sample is just a small part of a whole. For example, if you work for polling company and want to know how much people pay for food a year, you aren’t going to want to poll over 300 million people. Instead, you take a fraction of that 300 million (perhaps a thousand people); that fraction is called a sample. The mean is another word for “average.” So in this example, the sample mean would be the average amount those thousand people pay for food a year.
The sample mean is useful because it allows you to estimate what the whole population is doing, without surveying everyone. Let’s say your sample mean for the food example was $2400 per year. The odds are, you would get a very similar figure if you surveyed all 300 million people. So the sample mean is a way of saving a lot of time and money.
Formula
The sample mean formula is:
x̄ = ( Σ xi ) / n
If that looks complicated, it’s simpler than you think (although check out our tutoring page if you need help!). Remember the formula to find an “average” in basic math? It’s the exact same thing, only the notation (i.e. the symbols) are just different. Let’s break it down into parts:
- x̄ just stands for the “sample mean”
- Σ is summation notation, which means “add up”
- xi “all of the x-values”
- n means “the number of items in the sample”
Now it’s just a matter of plugging in numbers that you’re given and solving using arithmetic (there’s no algebra required—you can basically plug this in to any calculator).
You might see the following alternate sample mean formula:
x̄ = 1/ n * ( Σ xi )
The set up is slightly different, but algebraically it’s the same formula (if you simplify the formula 1/n * X, you get 1/X).
How to Find the Sample Mean

Finding the sample mean is no different from finding the average of a set of numbers. In statistics you’ll come across slightly different notation than you’re probably used to, but the math is exactly the same.
All that formula is saying is add up all of the numbers in your data set ( Σ means “add up” and xi means “all the numbers in the data set). This article tells you how to find the sample mean by hand (this is also one of the AP Statistics formulas). However, if you’re finding the sample mean, you’re probably going to be finding other descriptive statistics, like the sample variance or the interquartile range so you may want to consider finding the sample mean in Excel or other technology. Why? Although the calculation for the mean is fairly simple, if you use Excel then you only have to enter the numbers once. After that, you can use the numbers to find any statistic: not just the sample mean.
How to Find the Sample Mean: Steps
Sample Question: Find the sample mean for the following set of numbers: 12, 13, 14, 16, 17, 40, 43, 55, 56, 67, 78, 78, 79, 80, 81, 90, 99, 101, 102, 304, 306, 400, 401, 403, 404, 405.
Step 1:Add up all of the numbers:
12 + 13 + 14 + 16 + 17 + 40 + 43 + 55 + 56 + 67 + 78 + 78 + 79 + 80 + 81 + 90 + 99 + 101 + 102 + 304 + 306 + 400 + 401 + 403 + 404 + 405 = 3744.
Step 2:Count the numbers of items in your data set. In this particular data set there are 26 items.
Step 3:Divide the number you found in Step 1 by the number you found in Step 2. 3744/26 = 144.
That’s it!
Tip: If you have to show working out on a test, just place the two numbers into the formula. Step 1 gives you the σ and Step 2 gives you n:
x = ( Σ xi ) / n
= 3744/26
= 144
Variance of the sampling distribution of the sample mean
variance of the sampling distribution of the mean. If you aren’t familiar with the central limit theorem, you may want to read the previous article: The Mean of the Sampling Distribution of the Mean.Watch the video or read the article below:

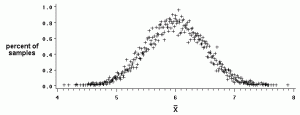
- Equal the population mean, μ
- Look like a normal distribution curve.
The variance of this probability distribution gives you an idea of how spread out your data is around the mean. The larger the sample size, the more closely the sample mean will represent the population mean. In other words, as N grows larger, the variance becomes smaller. Ideally, when the sample mean matches the population mean, the variance will equal zero.
The formula to find the variance of the sampling distribution of the mean is:
σ2M = σ2 / N,
where:
σ2M = variance of the sampling distribution of the sample mean.
σ2 = population variance.
N = your sample size.
Sample question: If a random sample of size 19 is drawn from a population distribution with standard deviation α = 20 then what will be the variance of the sampling distribution of the sample mean?
Step 1: Figure out the population variance. Variance is the standard deviation squared, so:
σ2 = 202 = 400.
Step 2: Divide the variance by the number of items in the sample. This sample has 19 items, so:
400 / 19 = 21.05.
That’s it!
Calculate Standard Error for the Sample Mean
Watch the video for the steps:
How to Calculate Standard Error for the Sample Mean: Overview

The standard error of the mean of a sample is equal to the standard deviation for the sample. The difference between standard error and standard deviation is that with standard deviations you use population data (i.e. parameters) and with standard errors you use data from your sample. You can calculate standard error for the sample mean using the formula:
SE = s / √(n)
SE = standard error, s = the standard deviation for your sample and n is the number of items in your sample.
Calculate Standard Error for the Sample Mean: Steps
Example: Find the standard error for the following heights (in cm): Jim (170.5), John (161), Jack (160), Freda (170), Tai (150.5).
Step 1: Find the mean (the average) of the data set: (170.5 + 161 + 160 + 170 + 150.5) / 5 = 162.4.
Step 2: Calculate the deviation from the mean by subtracting each value from the mean you found in Step 1.
170.5 – 162.4 = -8.1
161 – 162.4 = 1.4
160 – 162.4 = 2.4
170 – 162.4 = -7.6
150.5 – 162.4 = 11.9
Step 3: Square the numbers you calculated in Step 2:
-8.1 * -8.1 = 65.61
1.4 * 1.4 = 1.96
2.4 * 2.4 = 5.76
-7.6 * -7.6 = 57.76
11.9 * 11.9 = 141.61
Step 4: Add the values you calculated in Step 3:
65.61 + 1.96 + 5.76 + 57.76 + 141.61 = 272.7
Step 5: Divide the number you found in Step 4 by your sample size – 1. There are five items in the sample, so n-1 = 4:
272.7 / 4 = 68.175.
Step 6: Take the square root of the number you found in Step 5. This is your standard deviation.
√(68.175) = 8.257
Step 6: Divide the number you calculated in Step 6 by the square root of the sample size (in this sample problem, the sample size is 5):
8.257 / √(5) = 8.257 / 2.236 = 3.693
That’s how to calculate the standard error for the sample mean!
Tip: If you’re asked to find the “standard error” for a sample, in most cases you’re finding the sample error for the mean using the formula SE = s/√n. There are different types of standard error though (i.e. for proportions), so you may want to make sure you’re calculating the right statistic.
References
Evans, M.; Hastings, N.; and Peacock, B. Statistical Distributions, 3rd ed. New York: Wiley, p. 16, 2000.
Kenney, J. F. and Keeping, E. S. “Averages,” “Relation Between Mean, Median, and Mode,” and “Relative Merits of Mean, Median, and Mode.” §3.1 and §4.8-4.9 in Mathematics of Statistics, Pt. 1, 3rd ed. Princeton, NJ: Van Nostrand, pp. 32 and 52-54, 1962.