Statistics Definitions > Mode
Contents:
- What is the Mode?
- How to find the mode by hand
- How to find the mode using Excel
- Find the mode in Minitab
What is the Mode?
The mode, or modal value, is the most common number in a data set. It’s useful in statistics because it can tell you what the most popular item in your set is. For example, you might have results from a customer survey where your company is rated from 1 to 5. If the most popular answer is 2, then you know you need to make some improvements in customer service!
A data set can have no mode, one, or many:
- None: 1, 2, 3, 4, 6, 8, 9.
- One mode: unimodal: 1, 2, 3, 3, 4, 5.
- Two: bimodal: 1, 1, 2, 3, 4, 4, 5.
- Three: trimodal: 1, 1, 2, 3, 3, 4, 5, 5.
- More than one (two, three or more) = multimodal.
Note: Sometimes the mode is shortened to “mod”; Don’t confuse this with a modulo function (from calculus).
Histograms and Modes
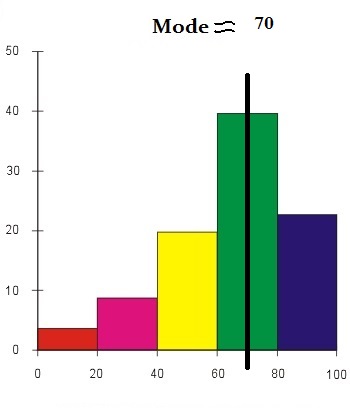
A histogram shows frequencies of values. In other words, how often a value appears in a data set. Look for the “bump” in the histogram. In the histogram below, the bump is at 4:

In real life, you’ll rarely (if ever) see a histogram with single digit numbers on the x-axis. You’ll see bars that are groups of numbers. For example a bar might represent 10 to 20, or it might represent 30-40. The technique is still the same — look for the “bump” in the histogram. With histograms that have bars with groups of numbers, you’ll have to ballpark where exactly the number is. The easiest way to do it is to take the number to the left and right of the highest bar and figure out where the middle is.
Fun Fact
A relationship between the mode, mean and median for unimodal distribution curves that are moderately asymmetry is given by this equation:
Mean – mod ≈ 3(mean – median).
How to find the mode by hand
Need help with a homework question? Check out our tutoring page!
The mode in statistics is the most common number in a data set. For example, in this set it’s 2, because it is the number that occurs most often: 1, 2, 2, 5, 6. Data sets in statistics tend to be much larger, so the solution is easier to spot if you put the numbers in order.
Steps
Sample question: Find the mode for the following data set:
56, 57, 56, 58, 59, 90, 98, 98, 65, 45, 34, 34, 23, 23, 24, 33, 56, 67, 78, 87, 87, 56.
Step 1: Put the numbers in order:
23 23 24 33 34 34 45 56 56 56 56 57 58 59 65 67 78 87 87 90 98 98
Step 2: Count how many times each number appears. This may be easier if you put the numbers in a column/row format like this:
23 23
24
33
34 34
45
56 56 56 56
57
58
59
65
67
78
87 87
90
98 98
The most common number is 56 in this data set (it appears 4 times).
How to find the mode in Microsoft Excel
Contents:
Using the Sort Button
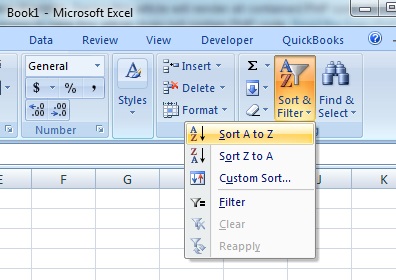
If you have a large number of items in your data set, Excel has a “Sort” button on the toolbar that will sort numbers from smallest to largest or largest to smallest. Type your numbers into a single column in Excel. Click “Home,” then click “Sort and Filter” and then click “A to Z” to sort from smallest to largest or “Z to A” to sort from largest to smallest.
Excel 2013
There are a couple of additional ways to find the mode in Excel 2013: the MODE function and Data Analysis Toolpak.
MODE Function
Step 1: Type your data into a single column for each set. For example, if you have one set, type your data into F1 to F20.
Step 2: Type “=MODE(F1:F20)”
where “F1:F20” is the location of your data set.
Step 3: Press “Enter.”
That’s it!
Data Analysis
Step 1: Click the “Data” tab and then click “Data Analysis.”
Step 2: Click “Descriptive Statistics” and then click “OK.”
Step 3: Click the Input Range box and then type the location for your data. For example, if you typed your data into cells A1 to A10, type “A1:A10” into that box
Step 4: Click the radio button for Rows or Columns, depending on how your data is laid out.
Step 5: Click the “Labels in first row” box if your data has column headers.
Step 6: Click the “Descriptive Statistics” check box.
Step 7: Select a location for your output. For example, click the “New Worksheet” radio button.
Step 8: Click “OK.”
Excel 2007-2010
Steps
Use a function to find the mode in Microsoft Excel
Step 1: Type your data into one column. Enter only one number in each cell. For example, if you have twenty data points, type that data into cells A1 through A20. Press “Enter” after each number entry to move down the column.
Step 2: Click a blank cell anywhere on the worksheet and then type “=MODE.SNGL(A1:A2)” without the quotation marks.
Step 3: Change the range in Step 2 to reflect your actual data. For example, if your numbers are in cells A1 through A20, change A1:A2 to A1:A20.
Step 4: Press “Enter.” Excel will return the solution in the cell with the formula.
Data Analysis
Step 1: Complete Step 1 above.
Step 2: Click the “Data” tab and then click “Data Analysis.” If Data Analysis does not show up on your ribbon, it means you don’t have it loaded. How to load the Data Analysis Toolpak.
Step 3: Click “Descriptive Statistics”.
Tip: You could also type up to 254 numbers into a function argument. Click on a cell and then type “MODE.SNGL(num1,num2,num3…)” where num1,num2,num3 are your actual numbers. For example “=MODE.SNGL({5.6,4,4,3,2,4})” would return 4 as the solution for the data set.
Tip: Earlier versions of Excel used “MODE” instead of “MODE.SNGL.” The function was replaced in Excel 2010 because the algorithm was inaccurate.
Note on the MODE.MULT function: The steps for using the MODE.MULT function are exactly the same. However, the MODE.MULT function will tell you if there are multiple modes.
Check out our YouTube channel for more Excel tips and help!
How to find the mode in Minitab
Finding a mode in Minitab takes seconds, once you have entered your data into a worksheet.
Example problem: Find the mode for the following data set: 12, 12, 13, 15, 21, 23, 23, 24, 25, 25, 26, 45, 45, 45, 45, 45, 45, 45, 51, 52, 53, 53, 54, 56, 56, 56, 57, 58, 59, 65, 78, 78, 85, 87, 88, 89, 89, 89.
Step 1: Type your data into a single column in a Minitab worksheet.
Step 2: Click “Stat”, then click “Basic Statistics,” then click “Descriptive Statistics.”
Step 3: Click the variables you want to find the mode for and then click “Select” to move the variable names to the right window.
Step 4: Click “Statistics.”
Step 5: Check the “Mode” box and then click “OK” twice. The result will be displayed in a new Minitab Session window. The solution for this particular set of data is 45.
That’s it!
References
Gonick, L. (1993). The Cartoon Guide to Statistics. HarperPerennial.
Lindstrom, D. (2010). Schaum’s Easy Outline of Statistics, Second Edition (Schaum’s Easy Outlines) 2nd Edition. McGraw-Hill Education