How to Find a Coefficient of Variation: Contents:
- What is the Coefficient of Variation?
- How to Find the Coefficient of Variation
- What is a good CV?
- Disadvantages
What is the Coefficient of Variation?
The coefficient of variation (CV) is a measure of relative variability. For example, the expression “The standard deviation is 15% of the mean” is a CV. It is the ratio of the standard deviation to the mean (average): 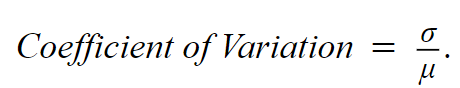 When you have a sample, you usually don’t have access to the population mean, μ. In this case, you’ll want to use the sample mean, x̄, instead:
 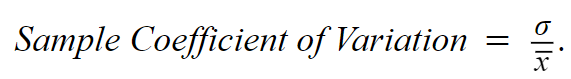 In a mathematical modeling setting, the CV is calculated as the root mean squared error (RMSE) divided by the mean of the dependent variable [1]. The RMSE is a measure of difference between the predicted and observed values. The coefficient of variation is particularly useful when comparing results from two different surveys or tests that have different measures, scoring mechanisms, or values. For example, the measure can be used to compare variability between results from a standard IQ test and a Woodcock-Johnson III Test of Cognitive Abilities. If one result has a CV of 12% and second result has a CV of 25%, you would say that sample B has more variation, relative to its mean.
Coefficient of Variation Example
A researcher is comparing two multiple-choice tests with different conditions. In the first test, a typical multiple-choice test is administered. In the second test, alternative choices (i.e. incorrect answers) are randomly assigned to test takers. The results from the two tests are:
| Regular Test | Randomized Answers | |
| Mean | 59.9 | 44.8 |
| SD | 10.2 | 12.7 |
Trying to compare the two test results is challenging. Comparing standard deviations doesn’t really work, because the means are also different. Calculation using the formula CV=(SD/Mean)*100 helps to make sense of the data (Multiplying the coefficient by 100 is an optional step to get a percentage, as opposed to a decimal.):
| Regular Test | Randomized Answers | |
| Mean | 59.9 | 44.8 |
| SD | 10.2 | 12.7 |
| CV | 17.03 | 28.35 |
Looking at the standard deviations of 10.2 and 12.7, you might think that the tests have similar results. However, when you adjust for the difference in the means, the results have more significance:
- Regular test: CV = 17.03
- Randomized answers: CV = 28.35.
Note: The Coefficient of Variation should only be used to compare positive data on a ratio scale. The CV has little or no meaning for measurements on an interval scale. Examples of interval scales include temperatures in Celsius or Fahrenheit, while the Kelvin scale is a ratio scale that starts at zero and cannot, by definition, take on a negative value (0 degrees Kelvin is the absence of heat).
How to find a coefficient of variation in Excel.
You can calculate the coefficient of variation in Excel using the formulas for standard deviation and mean. For a given column of data (i.e. A1:A10), you could enter: “=stdev(A1:A10)/average(A1:A10)) then multiply by 100.
How to Find a Coefficient of Variation by hand: Steps.
Example question: Two versions of a test are given to students. One test has pre-set answers and a second test has randomized answers. Find the coefficient of variation.
| Regular Test | Randomized Answers | |
| Mean | 50.1 | 45.8 |
| SD | 11.2 | 12.9 |
- Divide the standard deviation by the mean for the first sample: 11.2 / 50.1 = 0.22355
- Multiply Step 1 by 100: 0.22355 * 100 = 22.355%
- Divide the standard deviation by the mean for the second sample: 12.9 / 45.8 = 0.28166
- Multiply Step 3 by 100: 0.28166 * 100 = 28.266%
That’s it! Now you can compare the two results directly: the second test has widen variability (CV = 28.27) than the first test (22.36%). This may, for example, indicate that the second test is more confusing for students.
What does the CV tell us?
A CV of 0 indicates there is zero variability, while a CV of 100 indicates that the data is widely spread out.
Another example: Let’s say we wanted to compare results for two multiple-choice tests. The first test follows a typical format, while the second test randomizes the answer choices:
The results from the two tests are:
| Typical Test | Randomized answers test | |
| Mean | 60 | 44 |
| SD | 10 | 12 |
| CV | (10/60) * 100 = 16.67 | (12/44) * 100 = 27.27 |
Comparing these results can be challenging due to the differences in means and standard deviations. The similar standard deviations might lead us to believe that the tests are fairly close. But when we adjust for the means — with the coefficient of variation — we can see that there is a large gap in performance between the two tests.
Coefficient of variation vs. standard deviation
The coefficient of variation (CV) and the standard deviation (SD) are both measures of variability. However, they have different strengths and weaknesses.
- The CV is dimensionless — it doesn’t depend on the units of measurement.
- The SD is often expressed in the same units as the data.
While the CV i can compare variability for datasets with different units of measurement, this is not the case for the SD, which can only be used to compare datasets with the same units. One big advantage of the SD is that it is more robust than the CV, which means it is less affected by outliers and other changes to data.
What is a “good” coefficient of variation?
A “good” CV depends upon the instrument being used, the test methodology, and the range of results [2]. In general, a CV of 20-30 is generally considered “good.” This implies that the data is adequately spread out, yet not so much that it becomes difficult to interpret.
Some additional factors to consider when interpreting the CV:
- The CV may obscure the true effects of outcomes [3]. The coefficient of variation combines two characteristics, the standard deviation and the mean, which can have independent effects on certain outcomes. For instance, organizational demography literature suggests that heterogeneity in a tenure distribution should increase turnover. However, mean tenure is expected to have a negative effect on turnover and other organizational outcomes. Since each component is expected to have an effect, it is problematic to combine tenure and dispersion in a single measure. In addition, because the mean enters the coefficient of variation in the denominator, its effects on turnover rates are inverted. If mean tenure has the hypothesized negative effect on exit rates, the coefficient of variation may appear to positively affect turnover even if there are no effects of tenure heterogeneity.
- The coefficient of variation can be seen as an interaction effect between the standard deviation and the inverse of the mean. In a fully specified model, this interaction would be considered if the effect of the standard deviation is thought to be dampened in proportion to the mean. However, some models only include the interaction term between the standard deviation and the mean. A model may be justified if there are a priori reasons to expect the coefficients on the standard deviation and the mean to be equal to zero. However, it can be challenging to find these justifications in the literature.
- It is hard to imagine compelling reasons to expect these coefficients to be zero, taking into account organizational demography theory. If $1 and $2 are not both equal to zero, then the model suffers from omitted variable bias in estimating $3 in equation (2). It would be more conservative to estimate the full model in equation (1) first.
- The coefficient of variation might not accurately capture the concept of heterogeneity in some theories. This coefficient can be used to compare heterogeneity relative to mean levels. However, in the literature, discussions using the coefficient of variation do not always consider its relativism, but rather assume that it measures absolute differences in dispersion. This raises interpretive problems, as some data can have the same absolute dispersions (standard deviations) but different relative dispersions (CV) if their means vary.
Check out our YouTube channel for more stats help and tips.
References
- FAQ: WHAT IS THE COEFFICIENT OF VARIATION? Retrieved July 21, 2023 from: https://stats.oarc.ucla.edu/other/mult-pkg/faq/general/faq-what-is-the-coefficient-of-variation/
- Clinical Laboratory – Fundamentals
- Jesper B. Sørensen. The Use and Misuse of the Coefficient of Variation in Organizational Demography Research. Retrieved July 21, 2023 from: https://web.stanford.edu/~sorensen/nomorecv%20revision%20final.pdf
- Type of data: CV is mainly used for continuous data but can be applied to categorical data too.
- Scale of data: the CV has no meaning for ordinal scale data, as the standard deviation is not meaningful for this type of data.
- Outliers: CV is sensitive to outliers, leading to higher values in datasets that contain outliers than those without.
Disadvantages of using the CV
There are three significant drawbacks associated with using the coefficient of variation [3].
- The CV may obscure the true effects of outcomes [3]. The coefficient of variation combines two characteristics, the standard deviation and the mean, which can have independent effects on certain outcomes. For instance, organizational demography literature suggests that heterogeneity in a tenure distribution should increase turnover. However, mean tenure is expected to have a negative effect on turnover and other organizational outcomes. Since each component is expected to have an effect, it is problematic to combine tenure and dispersion in a single measure. In addition, because the mean enters the coefficient of variation in the denominator, its effects on turnover rates are inverted. If mean tenure has the hypothesized negative effect on exit rates, the coefficient of variation may appear to positively affect turnover even if there are no effects of tenure heterogeneity.
- The coefficient of variation can be seen as an interaction effect between the standard deviation and the inverse of the mean. In a fully specified model, this interaction would be considered if the effect of the standard deviation is thought to be dampened in proportion to the mean. However, some models only include the interaction term between the standard deviation and the mean. A model may be justified if there are a priori reasons to expect the coefficients on the standard deviation and the mean to be equal to zero. However, it can be challenging to find these justifications in the literature.
- It is hard to imagine compelling reasons to expect these coefficients to be zero, taking into account organizational demography theory. If $1 and $2 are not both equal to zero, then the model suffers from omitted variable bias in estimating $3 in equation (2). It would be more conservative to estimate the full model in equation (1) first.
- The coefficient of variation might not accurately capture the concept of heterogeneity in some theories. This coefficient can be used to compare heterogeneity relative to mean levels. However, in the literature, discussions using the coefficient of variation do not always consider its relativism, but rather assume that it measures absolute differences in dispersion. This raises interpretive problems, as some data can have the same absolute dispersions (standard deviations) but different relative dispersions (CV) if their means vary.
Check out our YouTube channel for more stats help and tips.
References
- FAQ: WHAT IS THE COEFFICIENT OF VARIATION? Retrieved July 21, 2023 from: https://stats.oarc.ucla.edu/other/mult-pkg/faq/general/faq-what-is-the-coefficient-of-variation/
- Clinical Laboratory – Fundamentals
- Jesper B. Sørensen. The Use and Misuse of the Coefficient of Variation in Organizational Demography Research. Retrieved July 21, 2023 from: https://web.stanford.edu/~sorensen/nomorecv%20revision%20final.pdf