Basic Statistics > Mean in Excel
Contents:
1. Mean in Excel 2016-2013
Watch the video or read the steps below:
The mean, also called the average, is a measure of spread in statistics. The mean is calculated by adding up all the numbers in your data set and then dividing by the number of items. It may seem like an easy calculation, but it can become quite complex with larger data sets (think—thousands of numbers!).
If you want to find a mean in Excel 2016 or 2013, you have two options: The “Average” function and the Data Analysis Toolpak. If you haven’t already loaded the Toolpak into Excel, you’ll need to before you can use that function (How to load the Data Analysis Toolpak).
How to Find a Mean in Excel 2016 or 2013: AVERAGE function
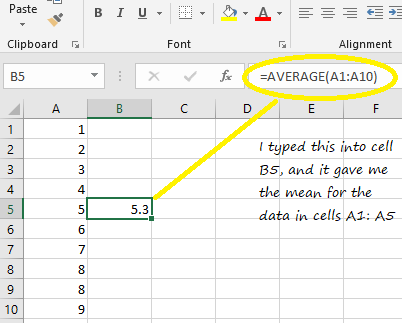
Step 2: Type “=AVERAGE(A1:A10)” where A1:A10 is the location of your data set. For example, if you want to find a mean for a data set in cells A1 to A99, type “A1:A99”.
Step 3: Press “Enter” to display the mean.
How to Find a Mean in Excel 2016-2013: Data Analysis
Step 1: Click the “Data” tab and then click “Data Analysis.” If you don’t see the data analysis option, load the ToolPak.

Step 2: Click “Descriptive Statistics” and then click “OK.”
Step 3: Click the Input Range box and then type the location for your data. For example, if you typed your data into cells A1 to A10, type “A1:A10” into that box.
Step 4: Click the radio button for Rows or Columns, depending on how your data is laid out.
Step 5: Click the “Labels in first row” box if your data has column headers.
Step 6: Click the “Descriptive Statistics” check box. In 2016, this is called “Summary Statistics.”
Step 7: Select a location for your output. For example, click the “New Worksheet” radio button.
Step 8: Click “OK.” The mean is displayed at the top of the descriptive/summary statistics output.
2. Mean in Excel 2007 & 2010: Overview
 Most professors recommend a graphing calculator for statistics. But many of the functions can also be performed in Microsoft Excel. Excel has many advantages over the graphing calculator in some areas: it’s much easier to print out a graph or table (with the graphing calculator you would have to link your calculator to your computer with a cable, open the software and print from there), you’ve got a larger screen—which is useful if you have a large amount of data, and it’s easier to share your findings with other people. One of the most basic statistical functions in Excel is calculating the mean. There are three different ways to calculate the mean in Excel: use Autosum (which uses Σ—summation notation), use a function or use data analysis.
Mean in Excel 2007 & 2010: Steps
Watch the video or read the steps below:
Use Autosum to find the mean in Excel 2007 & 2010
Step 1: Type your data into a single column. Enter one number per cell. For example, if you have ten data points, type that data into cells A1 through A10.
Step 2: Click a blank cell immediately below your entries. For example, if you have your data in cells A1:A10, click cell A11.
Step 3: Click the arrow to the right of the Autosum button [Σ] on the ribbon and then click “Average“.
Step 4: Press “Enter.”
Use a function to find the mean in Excel 2007 & 2010
Step 1: Type your data into a single column. Enter one number per cell. For example, if you have ten data points, type that data into cells A1 through A10.
Step 2: Click a blank cell anywhere on the worksheet and then type “=AVERAGE(A2:A7)” without the quotation marks.
Step 3: Change the range in Step 2 to reflect your actual data. For example, if your data is in cells A1 through A10, change A2:A7 to A1:A10.
Step 4: Press “Enter.”
Use Data Analysis to find the mean in Excel 2007 & 2010
Step 1: Type your data into a single column. Enter one number per cell. For example, if you have ten data points, type that data into cells A1 through A10.
Step 2: Click “Data” and then click “Data Analysis.” If you don’t see Data Analysis, load the Data Analysis Toolpak.
Step 3: Click “Descriptive Statistics,” which will provide the mean and other statistics for your data set.
Check out our Youtube channel for more Excel and statistics tips!
