Outliers are data points that are significantly different from the majority of other data points. Basically, they are unusual values in a dataset.
Contents:
- What is an Outlier?
- How to Find Outliers with the Interquartile Range.
- How to Find Outliers with the Tukey Method and more advanced methods.
Watch the video below for a brief overview on how to find outliers:
Can’t see the video? Click here to watch it on YouTube.
What is an outlier?
An outlier is a piece of data that is an abnormal distance from other points. In other words, it’s data that lies outside the other values in the set. If you had Pinocchio in a class of children, the length of his nose compared to the other children would be an outlier. In this set of random numbers, 1 and 201 are outliers:
1, 99, 100, 101, 103, 109, 110, 201
“1” is an extremely low value and “201” is an extremely high value.
Outliers aren’t always that obvious. Let’s say you received the following paychecks last month:
$225, $250, $25, $235.
Your average paycheck is $135. But that small paycheck ($25) might be because you went on vacation, so a weekly paycheck average of $135 isn’t a true reflection of how much you earned. Your average is actually closer to $237 if you take the outlier ($25) out of the set. Of course, trying to find outliers isn’t always that simple. Your data set may look like this:
61, 10, 32, 19, 22, 29, 36, 14, 49, 3.
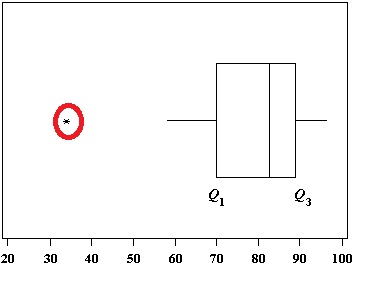
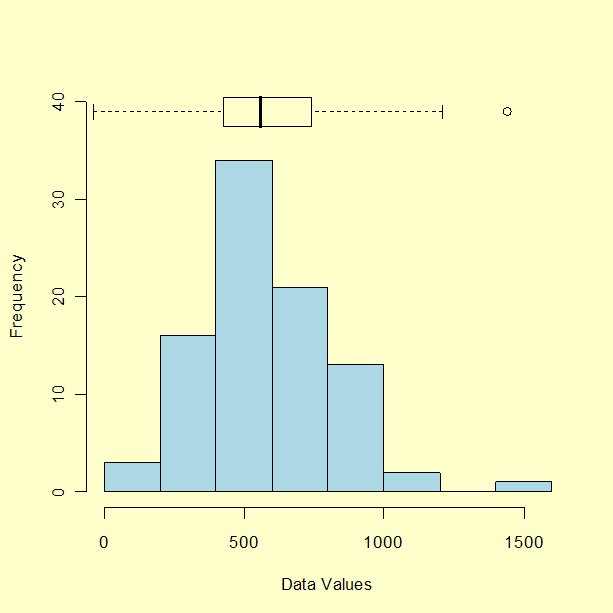
You could take a guess that 3 might be an outlier and perhaps 61. But you’d be wrong: 61 is the only outlier in this data set. A box and whiskers chart (boxplot) often shows outliers:
Some boxplots may not show outliers. For example, this chart has whiskers that reach out to include outliers: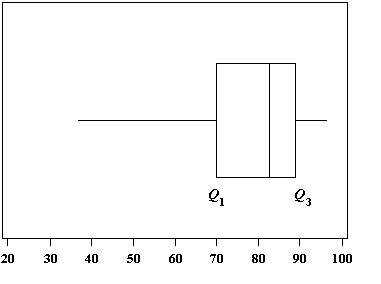 Therefore, don’t rely on finding outliers from a box and whiskers chart. That said, box and whiskers charts can be a useful tool to display them after you have calculated what your outliers actually are.
Outliers vs. extreme values
Outliers and extreme values are not the same thing. Outliers are data points far away from the rest of the distribution while extreme values are data points that are at the very high or very low end of the distribution. As a rule of thumb, if you have one or two high/low data points — those are outliers. On the other hand, if you have many high or low values, those are extreme values — and are often part of a probability distribution’s inherent nature.
This makes it challenging to tell the difference between a data point that’s an outlier, and one that is an extreme value. for example, consider the data set
-19, 3, 10, 14, 19, 22, 29, 32, 36, 49, 69, 70.
At first glance, you might guess that -19 is an outlier. But your guess would be just that — a guess. In order to figure out if an outlier is extreme, we can use Tukey’s fences, which defines an extreme data point as one that is beyond an outer fence.
How to Find Outliers Using the Interquartile Range(IQR)
An outlier is defined as being any point of data that lies over 1.5 IQRs below the first quartile (Q1) or above the third quartile (Q3)in a data set. High = (Q3) + 1.5 IQR Low = (Q1) – 1.5 IQR
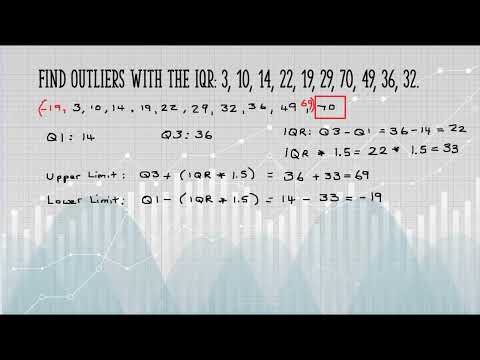
Example Question: Find the outliers for the following data set: 3, 10, 14, 22, 19, 29, 70, 49, 36, 32.
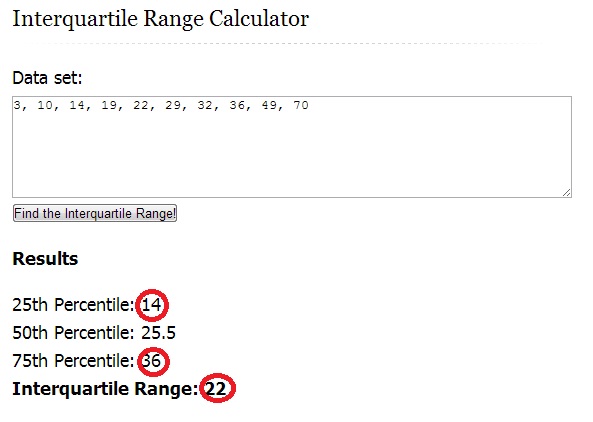
- Find the IQR, Q1(25th percentile) and Q3(75th percentile). Use our online interquartile range calculator to find the IQR or follow the steps in this article: Interquartile Range in Statistics: How to find it. IQR = 22 Q1 = 14 Q3 = 36

IQR, Q1 and Q3 found using the online calculator (see link in this step). -
Multiply the IQR you found in Step 1 by 1.5: IQR * 1.5 = 22 * 1.5 = 33.
-
Add the amount you found in Step 2 to Q3 from Step 1: 33 + 36 = 69. This is your upper limit. Set this number aside for a moment.
-
Subtract the amount you found in Step 2 from Q1 from Step 1: 14 – 33 = -19. This is your lower limit. Set this number aside for a moment.
-
Put the numbers from your data set in order: 3, 10, 14, 19, 22, 29, 32, 36, 49, 70
-
Insert your low and high values into your data set, in order: -19, 3, 10, 14, 19, 22, 29, 32, 36, 49, 69, 70
- Highlight any number below or above the numbers you inserted in Step 6: -19, 3, 10, 14, 19, 22, 29, 32, 36, 49, 69, 70
We have one outlier: 19.
That’s it!
How to Find Outliers with the The Tukey Method
The Tukey method for finding outliers uses the interquartile range to filter out very large or very small numbers. It’s practically the same as the procedure above, but you might see the formulas written slightly differently and the terminology is a little different as well. For example, the Tukey method uses the concept of “fences”. The formulas are:
- Low outliers = Q1 – 1.5(Q3 – Q1) = Q1 – 1.5(IQR)
- High outliers = Q3 + 1.5(Q3 – Q1) = Q3 + 1.5(IQR)
Where:
- Q1 = first quartile
- Q3 = third quartile
- IQR = Interquartile range
These equations give you two values, or “fences“. You can think of them as a fence that cordons off the outliers from all of the values that are contained in the bulk of the data.
Example question: Use Tukey’s method to find outliers for the following set of data: 1,2,5,6,7,9,12,15,18,19,38.
- Find the Interquartile range:
- Find the median: 1,2,5,6,7,9,12,15,18,19,38.
- Place parentheses around the numbers above and below the median — it makes Q1 and Q3 easier to find. (1, 2, 5, 6, 7), 9,( 12, 15, 18, 19, 38)
- Find Q1 and Q3. Q1 can be thought of as a median in the lower half of the data. Q3 can be thought of as a median for the upper half of data. (1, 2, 5, 6, 7), 9, ( 12, 15, 18, 19, 38). Q1 = 5 and Q3 = 18.
- Subtract Q1 from Q3. 18 – 5 = 13.
- Calculate 1.5 * IQR: 1.5 * IQR = 1.5 * 13 = 19.5
- Subtract from Q1 to get your lower fence: 5 – 19.5 = -14.5
- Add to Q3 to get your upper fence: 18 + 19.5 = 37.5.
- Add your fences to your data to identify outliers: (-14.5) 1,2,5,6,7,9,12,15,18,19,(37.5),38. Anything outside of the fences is an outlier.
For this data set, 38 is the only outlier.
That’s how to find outliers with the Tukey method!
How to find outliers in data with statistical tests
- Generalized ESD: used to identify outliers in data sets that are not normally distributed.
- Grubbs’ test. used to identify a single outlier in data sets that are normally distributed. If you have more than one outlier, it can distort results [1].
- Dixon’s Q Test. used to identify outliers in small data sets that are normally distributed. Popular with chemists, it calculates the ratio between the suspected outlier’s distance from its nearest neighbor and the range of values [2].
- Modified Thompson Tau Test: more robust to violations of normality.
- Peirce’s Criterion: uses the median and standard deviation of a data set to identify outliers.
Ultimately, the best test depends on the the characteristics of the data set and your own preferences.
Broadly speaking, the more robust a test is, the less susceptible it is to deviations from normality. This implies that it’s less prone to wrongly identifying outliers if the data isn’t normally distributed. If you suspect that your data may not follow a normal distribution, you might want to opt for one of the more robust tests, such as the Generalized ESD or Dixon’s Q. But if you’re confident that your data is approximately normal, a less robust test such as Grubbs’ or the Modified Thompson Tau test could be suitable.
Peirce’s Criterion is a relatively novel test that hasn’t gained as much traction as the other tests mentioned here. While its calculations might be more complex compared to other tests, it offers greater robustness.
| Test | Robustness | Assumptions |
|---|---|---|
| Generalized ESD | More robust than Grubbs’ | Does not assume normality. |
| Grubbs’ test | Less robust than Generalized ESD | Normality |
| Dixon’s Q test | More robust than Grubbs’ | Data is from a univariate normal distribution |
| Modified Thompson Tau test | More robust than Grubbs’ | Data is from a univariate normal distribution |
| Peirce’s Criterion | Very robust | Data is from a univariate normal distribution |
Outlier causes
Outliers can originate from various sources, including:
- Measurement inaccuracies: Outliers might result from measurement mistakes. For instance, an improperly calibrated thermometer might report readings that are excessively high or low.
- Errors in data input: Data entry mistakes can also lead to outliers. If an individual erroneously inputs a value significantly higher or lower than the other values in the dataset, it could generate an outlier.
- Inherent variation: Occasionally, outliers can stem from natural fluctuations. For example, when measuring the heights of a group of people, there will invariably be some individuals who are taller or shorter than the rest of the group.
Next: Modify Extreme Values with Winsorizations
References
Check out our YouTube channel for more stats tips and help!