Probability and Statistics >Basic Statistics > What is a Statistic?
Contents:
- What is a Statistic?
- What is the Difference Between Inferential and Descriptive Statistics?
- Notation
- Data & Variables
- Vital Statistics & Estimators
What is a Statistic?
A statistic is a piece of data from a portion of a population. It’s the opposite of a parameter — data from a census, which surveys everyone.
Think of it like this: If you have a bit of information, it’s a statistic. If you look at part of a data set, it’s also a statistic. If you know something about 10% of people, that’s a statistic too. Parameters are all the information. And all the information is rarely known, which is why we need stats!
What is a statistic used for?
Statistics is a way to understand the data that is collected about us and the world. For example, every time you send a package through the mail, that package is tracked in a huge database. The UPS database is 17 terabytes — about as big as if you cataloged every book in the Library of Congress. All of that data is meaningless without a way to interpret it, which is where statistics comes in.
Statistics describes data . It’s also about analyzing that data and producing some meaningful information about that data.
What is a Statistic: Types
Stats come in three types:
- Descriptive Statistics. Describe data. Includes sample mean or sample median. Order statistics are a subset of descriptive statistics. They tell you something about how the data is ordered. For example, measurements like the sample minimum. You know the order is #1. Also includes charts and graphs. Anything that describes data is descriptive statistics.
- Estimators.Used to guess at a parameter. In other words, something about a population. Often taken from descriptive stats. For example, if you know the sample mean you can use it to guess what the population mean is. Used in inferential statistics. Inferential stats is just a “best guess” about something, based on data.
- Test Statistics, which are used in null hypothesis testing. That’s where you take a known fact about a population and then test that fact to see if it is true or not. A “population” could be real people in a trial. Or it could be TVs in a factory. Which test statistic you use depends on what kind of data you have. Some examples of test stats: t score, and chi-square.
A statistic can be more than one type. For example, the sample standard deviation can be used as a descriptive statistic to describe the standard deviation of a sample. It can be used as an estimator: To estimate the population standard deviation. And it can be used to test a theory (a hypothesis).
Origin of Statistic
The word statistic indirectly comes from the medieval Latin word status, for a political state although there is also a closely related word in German (statistik) which is also used in a political sense. “Statistik” was popularized by German political scientist Gottfried Aschenwall (1719-1772) in his “Vorbereitung zur Staatswissenschaft” (1748).
According to Leiden University, it’s difficult to know exactly when the word ceased to have a meaning close to a “political state” and became more of a mathematical term. The first time the word was used in the Oxford English Dictionary is in 1770, in W. Hooper’s translation of Bielfield’s Elementary Universal Education: “The science, that is called statistics, teaches us what is the political arrangement of all the modern states of the known world.” The Online Etymology Dictionary states that the first recorded time the word meant “numerical data collected and classified” was 1829 and the abbreviated form stats first appeared in 1961.
Webster’s 1828 dictionary defines statistics as:
A collection of facts respecting the state of society, the condition of the people in a nation or country, their health, longevity, domestic economy, arts, property and political strength, the state of the country, &c.
What is the Difference Between Inferential and Descriptive Statistics?
Inferential means that you can infer (make predictions) from the data, while descriptive means that you just describe the data.
Difference Between Inferential and Descriptive Statistics: Example
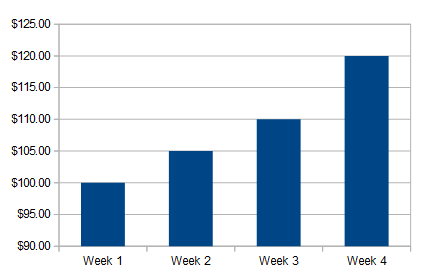
Let’s say you worked every week last month and received four paychecks: $100, $105, $110, and $120.
Examples of descriptive statistics about your pay (describing and summarizing the set of data)
Some options available to you:
- Find the mean (the average) = $100 + $105 + $110 + $120 / 4 = $108.75. You earned an average of $108.75 last week. You could also calculate other statistics about your pay like the median, range or standard deviation.
- Make a bar graph:

You could also make other charts like a pie chart, a line graph or a stem plot and you could also describe the shapes of those distributions (i.e. bell-shaped, skewed, or uniform).
Examples of inferential statistics about your pay (making predictions):
Perhaps the most obvious inference you can make from your pay is that there’s an upwards trend. It looks like it’s going up by $5 per week, so you can expect to earn $125 in week 5. You can quantify this trend by:
- Inserting a trendline: this is easy to do in Microsoft Excel (instructions can be found here). You could also draw a rough line by hand–grab a ruler, draw a pencil line, and make your predictions based on where the line is going. For your pay, the line is going upwards (it should have a positive slope).
- If you want an equation for the trendline, you can perform regression analysis, enabling you to easily predict what you’ll earn next, week, next month, or next year.
- More complex inferential statistics include hypothesis testing, where you take raw data and use a known model to verify the accuracy of your predictions. For this pay check example, you might compare your pay to the average pay of someone else working in your particular field.
What is a Statistic? Notation
In general, stats notation is in Roman letters, a-z. Parameters have Greek letters or uppercase Roman). If some letters look the same: look closely. For example, look for the small p and large P. Usually, if you see a large letter (i.e. P), it’s a parameter. Small letters usually mean it’s a stat.
| Measurement | Statistic (Roman or lowercase) | Parameter (Greek or uppercase) |
| Population Proportion | p | P |
| Data Elements | x | X |
| Population Mean | μ | |
| https://www.statisticshowto.com/probability-and-statistics/standard-deviation/ | s | σ |
| Variance | s2 | σ2 |
| Number of elements | n | N |
| Correlation Coefficient | r | ρ |
What is a Statistic: Data & Variables
You might think that data is a list of numbers. However, in statistics, “Data” means something a little different; Data contains the who and what about something (the “something” could be anything from a book in a bookstore to a batting average to a choice about elections). Data can have numerals that have meaning. For example, 1453767142 is the ISBN for the Practically Cheating Statistics Handbook. The What as it related to ISBNs is the name of the book (The Practically Cheating statistics Handbook) and the Who as it related to book sales could be the person who ordered the book or it could be the purchase orders (as opposed to the individuals who placed those orders).
What is a Statistic: Variable
You might be familiar with variables from algebra, like “x” or “y.” They stand for something (usually a number that you plug-in to solve an equation). In statistics, variables are broken down into two types: numerical or quantitative variables and categorical variables. Numerical variables are the variables you’re most familiar with: numbers. For example, those “x” and “y” variables in algebra stand for a number. Categorical variables are variables that aren’t numbers: they are descriptive. For example, sex (male or female), occupation, school district, state and dog breeds are all types of categorical variables.

Back to Top
What is a Statistic: Vital Statistics
Vital statistics can mean one of three things, as far as stats goes:
- National Vital Statistics System (run by the CDC) government records), a government database that keeps records of births, deaths, marriages, divorces, and fetal deaths.
- Bust-waist-hip measurements: measurements for clothes fitting, usually listed on a clothing size chart.
- Vital signs: Blood pressure and other body measurements taken by health professionals. For example, blood pressure and pulse are used to measure the health of your heart.
What is an Estimator?
An estimator (or estimate) is a statistic that’s used to approximate a population parameter. While there are several types of estimators, the word “estimator” on its own usually refers to a point estimate. A point estimate is a single value (as opposed to an interval, like a confidence interval). For example, the mean is a point estimate. The two characteristics of point estimates that are arguably most important are:
- Bias: whether the estimator underestimates or overestimates a parameter.
- Sampling variability: how much the estimate varies between samples.
Bias
When you visit a gas station, you expect that the gas pump is calibrated correctly. And in fact, it has the potential to be a very accurate calibration. However, state inspectors in Houston, Texas, found that around one in five gas pumps weren’t calibrated correctly. An incorrectly calibrated pump could cost a consumer up to 18 cubic inches per five gallons pumped. These pumps showed bias, by consistently overcharging consumers by a certain amount.
Many formulas in stats are designed to eliminate bias. For example, the formula for population variance is:
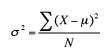
If this formula is used for the sample variance, it tends to underestimate the true population parameter. Therefore, a slightly modified formula is used with N-1 in the denominator:
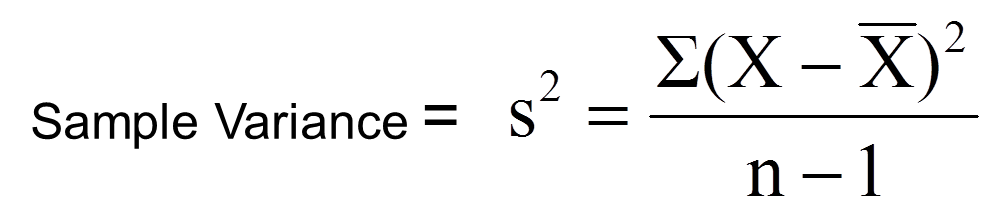
This formula is an unbiased estimate for the sample variance.
Sampling Variability
Your average bathroom scale probably goes up and down like a yoyo, stating a slightly different weight every time you get on it. Your weight might range from 158.1 one minute, to 161.2 the next. However, if you take a large enough sample (say, 30 measurements), your actual weight would probably be close to the mean of these readings. The widespread of weights (anywhere from 158.1 to 161.2) is one example of variability between samples.
Sampling variability is usually measured in terms of standard error. The larger the standard error, the larger the sampling variability.
What is a Statistic in The National Vital Statistics System?
The National Vital Statistics System is a database run by the Centers for Disease Control (CDC). Although the individual states are responsible for actually registering the data, the CDC collaborates with the National Center for Health Statistics, the National Cancer Institute and the Census Bureau to keep an up-to-date database of life and death statistics for the United States. Included are: births, deaths, marriages, divorces, and fetal deaths.
Additional programs related to the National Vital Statistics System include:
- The Linked Birth and Infant Death Data Set explores the connection between infant deaths and risk factors present at birth.
- National Survey of Family Growth. Collects information on family life, marriage and divorce, pregnancy, infertility, use of contraception, and the health of men and women.
- The Matched Multiple Birth Data Set keeps records on twins, triplets and quadruplets.
- National Death Index is a computerized index of death records. It is not available to the general public.
- The National Maternal and Infant Health Survey was conducted in 1988 and studied pregnancy risk factors for poor pregnancy outcomes like stillbirth and low birth weight.
- The National Mortality Followback Surveyattempted to find factors that affected mortality, like socioeconomic status, disability of use of health care facilities.