What is variance?
Variance measures the spread between numbers in a data set. It helps us determine how far each number in the set is from the mean or average, and from every other number in the set. It is calculated by taking the average of the squared differences from the mean.
The square root of the variance is the standard deviation. While variance gives you a rough idea of spread, the standard deviation is more concrete, giving you exact distances from the mean
- Population and sample variance calculation
- How Much Can Data Vary?
- Variance of a Binomial Distribution
- What is the difference between standard deviation and variance?
- Is variance mean deviation?
- What is the difference between variance and variation?
- What does “high variance” mean?
- Variance advantages and disadvantages
Population and sample variance calculation
By hand
Most of the time in statistics, you’ll want to find the sample variance, not the population variance. Why? Because statistics is usually all about making inferences from samples, not populations. If you had all of the data from a population, there would be no need for statistics at all!
That said, there really is very little difference between the formula for the population variance and the formula for the sample variance. Just make sure you use the population mean or sample mean(![]() ). In addition, the most common sample variance formula uses n-1 in the denominator instead of n.
). In addition, the most common sample variance formula uses n-1 in the denominator instead of n.
To calculate the variance for a population: 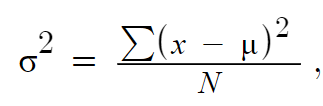 where:
- σ2 is the population variance
- ∑ is summation notation (i.e., add them all up!)
- X is a data point
- μ is the population mean
- N is the population size.
If you aren’t good with formulas, follow these steps:
- Find the mean(the average).
- Subtract the mean from each number in the data set and then square the results. The results are squared to make the negatives positive. Otherwise negative numbers would cancel out the positives in the next step. It’s the distance from the mean that’s important, not positive or negative numbers.
- Average the squared differences.
Example: find the population variance for 28, 29, 30, 31, 32.
- Find the mean: (28 + 29 + 30 + 31 + 32) / 5 = 30.
- Subtract the mean from each x-value:
- 28 – 30 = -2
- 29 – 30 = -1
- 30 – 30 = 0
- 31 – 30 = 1
- 32 – 30 = 2
- Square the values from Step 2:
- -22 = 4
- -12 = 1
- 02 = 0
- 12 = 1
- 22 = 4
- Sum the numbers from Step 3: 4 + 1 + 0 + 1 + 4 = 10
- Divide by the number of items in your data set: 10 / 5 = 2.
Example problem #2: A table can sometimes make things easier, especially if you have a long list of data point. Find the population variance for the following set of numbers: 28, 29, 30, 31, 32.
- Draw a table. Label the columns as shown and then write down your X values (the items in your population) in column 1:
X X-μ (X-μ)^2 28 29 30 31 32 - Find the mean. The mean for this set of data is (28 + 29 + 30 + 31 + 32) / 5 = 30.
- Fill in column 2. This column is your X value minus the mean. For example, the first entry is 28 – 30 = -2.
X X-μ (X-μ)^2 28 -2 29 -1 30 0 31 1 32 2 - Square the values from Step 3 and place those squares in the third column:
X X-μ (X-μ)^2 28 -2 4 29 -1 1 30 0 0 31 1 1 32 2 4 - Add up all of the numbers in column 3 (this is the summation Σ part of the formula): 4 + 1 + 0 + 1 + 4 = 10
- Divide by the number of items in your data set: 10 / 5 = 2 The population variance for this set of data is 2.
It’s more usual in statistics to find the sample variance. The steps are the same, but the notation is slightly different. Here’s the formula: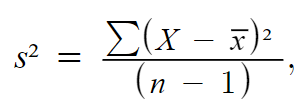
where
- s2 is the sample variance
- ∑ is the sum (i.e., add them all up!)
- X is a data point
- x̄ is the sample mean
- n is the sample size.
Why n – 1? The n-1 (called Bessel’s correction) in the sample variance formula is a correction factor to adjust the result because the sample mean tends to underestimate the population mean.
Use our online variance and standard deviation calculator, which shows you the step-by-step calculations for your individual data set.
Variance on a TI-83
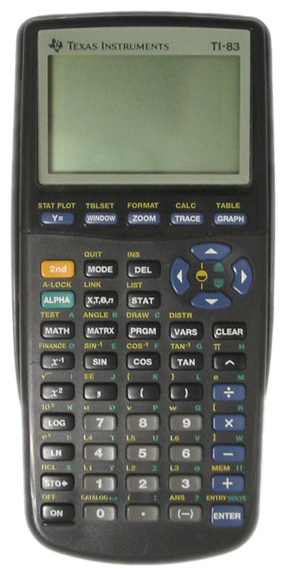 You could find the standard deviation for a list of data using the TI 83 calculator and square the result, but you won’t get an accurate answer unless you square the entire answer, including all of the significant digits. There’s a “trick” to getting the TI-83 variance, and it involves copying the standard deviation to the Home screen and then squaring it to get the variance.
Variance on a TI-83: Steps
Example problem: Find the variance for the heights of the top 12 buildings in London, England. The heights, (in feet) are: 800, 720, 655, 655, 625, 600, 590, 529, 513, 502, 502, 502.
- Enter the above data into a list. Press the STAT button and then press ENTER. Enter the first number (800), and then press ENTER. Continue entering numbers, pressing ENTER after each entry.
- Press STAT.
- Press the right arrow button (the arrow keys are located at the top right of the keypad) to select Calc.
- Press ENTER to highlight 1-Var Stats.
- Press ENTER again to bring up a list of stats.
- Press VARS 5 to bring up a list of the available Statistics variables.
- Press 3 to select “Sx” which is our standard deviation.
- Press x2, then Enter to display the variance, which is 9326.628788.
That’s how to find the Variance on a TI-83! Back to Top Lost your guidebook? You can download a new one here from the Texas Instruments website.
Minitab Instructions
Example question: Find the variance for the following sample: 12, 13, 24, 24, 25, 26, 34, 35, 38, 45, 46, 52, 53, 78, 78, 89
- Type your data into a column in a Minitab worksheet.
- Click “Stat”, then click “Basic Statistics,” then click “Descriptive Statistics.”
- Click the variables you want to find the variance for and then click “Select” to move the variable names to the right window.
- Click “Statistics.”
- Check the “Variance” box and then click “OK” twice. The variance in Minitab will be displayed in a new window. The variance for this particular data set is 540.667.
That’s it!
How Much Can Data Vary?
The smallest a variance gets is zero, but technically, it can be infinite with numbers in the millions or even billions and beyond.
Variance of a Binomial Distribution
A binomial distribution is a simple experiment where there is “success” or “failure.” For example, choosing a winning lottery ticket could be a binomial experiment (you either win or lose!). Tossing a coin to try and get heads is also binomial (with tossing a heads being a “success” and a tails a “failure”). The formula for the variance of binomial distribution is n*p (1-p) or n*p*q. The two formulas are equivalent because q = (1 – p).
Example problem: If you flip a coin 50 times and try to get heads, what is the variance of binomial distribution?
- Find “p”. The first step to solving this problem is to realize that the probability of getting a heads is 50 percent, or .5. Therefore, “p” (the probability) is .5.
- Find “q”, or 1-p. These two are equivalent. They are the probability of not getting a heads (in other words, the probability of getting a tails). 1 – 0.5 = 0.5. Therefore, “q” (or 1 – p) = 0.5.
- Multiply Step 1 (p) by Step 2 (q) by “n” (the number of trials). We are flipping the coin 50 times, so the number of trials is 50 (n = 50). So, N * p * q = 50 * .5 * .5 = 12.5.
The var. of binomial distribution for flipping a coin 50 times is 12.5.
OK, So what does the Binomial Variance mean? In essence, not a lot! The variance isn’t used for much at all, except for calculating standard deviation. For example, the standard deviation for this particular binomial distribution is: √12.5 = 3.54.
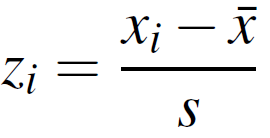
You’ll use the variance for things like calculating z-scores (this typically comes later in a stats class, after normal distributions), which has a standard deviation in the bottom of the formula:
What is the difference between standard deviation and variance?
Standard deviation is the square root of variance. While variance gives you a general idea of the spread of data, the standard deviation is more concrete, giving you exact distances from the mean.
For example, if you had data from a normal distribution with a mean of 50 and a standard deviation of 10, then 68% of the distribution would be between 50 – 10 = 40 and 50 +10 = 60 [1].
We know this because of the empirical rule (aka the 68-95-99 rule). The variance does not give you this information, which is why we use standard deviation instead of variance in statistical analysis.
Is variance mean deviation?
No, variance is not the same as mean deviation.
- Mean deviation is expressed in the same units as the data. The formula is MD = ∑|x – μ| / n.
- Variance is measured in squared units. The formula is ∑(x – μ)2 / n
As mean deviation is expressed in the same units as the data, that makes it easier to interpret although it isn’t considered a reliable measure of variability. Mean deviation is sometimes used with variance to give a more comprehensive understanding of how a data set is distributed.
What is the difference between variance and variation?
The terms “variance” and “variation” are often used interchangeably, but they mean different things:
- Variance tells us how spread out a dataset is from the mean.
- Variation is a broader term to describe the amount of difference or change present in a dataset. It can be quantified using the variance, but also the standard deviation or range.
Variance is a specific form of variation, while variation is a more general concept that includes any type of difference or change in a dataset.
What does “high variance” mean?
A high variance indicates that the data points in a set are widely spread out, with a significant difference between the mean and the standard deviation. Put simply, the data points are not concentrated around the mean.
Variance advantages and disadvantages
Advantages:
- Relatively easy to understand.
- Treats all deviations from the mean as the same regardless of their direction.
Versatile measure that can be used in a variety of settings.
Disadvantages:
- Not as interpretable as the standard deviation.
- Measured in squared units, which can make it difficult to compare different data sets.
- Can be affected by the number of data points, which can make it difficult to compare data sets with different sizes.
The variance is sensitive to outliers, which can be useful to identify unusual data points. But this can also be a disadvantage because squaring numbers can skew the data.
Check out our YouTube channel for hundreds of step-by-step statistics videos.
References
- Maricopa Community College. 5. Chapter 5: Measures of Dispersion