Statistics Definitions > Test Statistic
A test statistic is used in a hypothesis test when you are deciding to support or reject the null hypothesis. The test statistic takes your data from an experiment or survey and compares your results to the results you would expect from the null hypothesis.
The test statistic is a number that describes how much your test results differ from the null hypothesis. For example, let’s say that you think Drug X will cure warts. The currently accepted fact (the null hypothesis) is that about 30% of warts will go away on their own. You conduct a clinical trial and find that 57% of your patients are cured with drug X. Is this a significant result? Does the drug work? Is the 57% a fluke result? You can answer these questions with a test statistic in combination with a probability value (p-value).
Test Statistics and P-Values
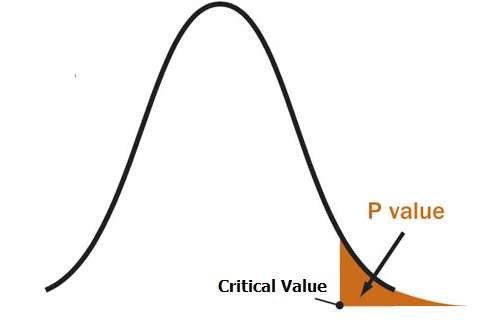
When you run a hypothesis test, you’ll use a distribution like a t-distribution or normal distribution. These have a known area, and enable to you to calculate a p-value that will tell you if your results are due to chance, or if your results are die to your theory being correct. The larger the test statistic, the smaller the p-value and the more likely you are to reject the null hypothesis.
Types of Test Statistic
There are four main statistics you can use in a hypothesis test. Which one you use depends on which statistical test you run. Click on one of the test names or scores to find out more about that particular test.
| Hypothesis Test | Test Statistic |
| Z-Test | Z-Score |
| T-Test | T-Score |
| ANOVA | F-statistic |
| Chi-Square Test | Chi-square statistic |
References
Gonick, L. & Smith, W. (1993). The Cartoon Guide to Statistics. HarperPerennial.