Contents:
T Scores in Statistics.
What is the T Score Formula?
T Score Formula Example
T Scores in Psychometrics
T Scores in Statistics
Watch the video for an overview of the formula:

Can’t see the video? Click here to watch it on YouTube.
What is the T Score Formula?
A t score is one form of a standardized test statistic (the other you’ll come across in elementary statistics is the z-score). The t score formula enables you to take an individual score and transform it into a standardized form>one which helps you to compare scores.
You’ll want to use the t score formula when you don’t know the population standard deviation and you have a small sample (under 30).
The t score formula is:

Where
x̄ = sample mean
μ0 = population mean
s = sample standard deviation
n = sample size
If you have only one item in your sample, the square root in the denominator becomes √1. This means the formula becomes:

In simple terms, the larger the t score, the larger the difference is between the groups you are testing. It’s influenced by many factors including:
The standard deviation of your sample.
What is the T Score Formula used for?
You traditionally look up a t score in a t-table. The number of items in your sample, minus one, is your degrees of freedom. For example, if you have 20 items in your sample, then df = 19. You use the degrees of freedom along with the confidence level you are willing to accept, to decide whether to support or reject the null hypothesis.
The t score formula can also be used to solve probability questions. You won’t have an alpha level, but you can use the result from the formula, along with a calculator like the TI-83, to find probabilities.
The following example shows how to calculate a t-score formula for a single sample. Paired samples and independent samples use different formulas.
- If you have paired samples, follow the instructions in the paired samples t-test.
- For independent samples, see: independent samples t-test.
Example of the T Score Formula
Need help with a homework question? Check out our tutoring page!
Example question:
A law school claims it’s graduates earn an average of $300 per hour. A sample of 15 graduates is selected and found to have a mean salary of $280 with a sample standard deviation of $50. Assuming the school’s claim is true, what is the probability that the mean salary of graduates will be no more than $280?
Step 1: Plug the information into the formula and solve:
x̄ = sample mean = 280
μ0 = population mean = 300
s = sample standard deviation = 50
n = sample size = 15
t = (280 – 300)/ (50/√15) = -20 / 12.909945 = -1.549.
Step 2: Subtract 1 from the sample size to get the degrees of freedom:
15 – 1 = 14. The degrees of freedom lets you know which form of the t distribution to use (there are many, but you can solve these problems without knowing that fact!).
Step 3: Use a calculator to find the probability using your degrees of freedom (8). You have several options, including the TI-83 (see How to find a t distribution on a TI 83). Here’s the result from an online calculator I found a few years back (now defunct). Note that I selected the radio button under the left tail, as we’re looking for a result that’s no more than $280:
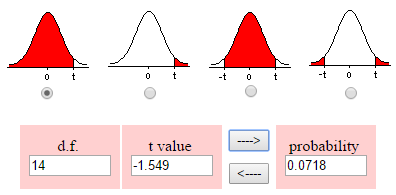
The probability is 0.0718, or 7.18%.
T Scores in Psychometrics
A t score in psychometric (psychological) testing is a specialized term that is not the same thing as a t score that you get from a t-test.
T scores in t-tests can be positive or negative. T scores in psychometric testing are always positive, with a mean of 50.
A difference of 10 (positive or negative) from the mean is a difference of one standard deviation. For example, a score of 70 is two standard deviations above the mean, while a score of 0 is one standard deviations below the mean.
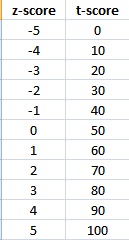
A t score is similar to a z score — it represents the number of standard deviations from the mean. While the z-score returns values from between -5 and 5 (most scores fall between -3 and 3) standard deviations from the mean, the t score has a greater value and returns results from between 0 to 100 (most scores will fall between 20 and 80). Many people prefer t scores because the lack of negative numbers means they are easier to work with and there is a larger range so decimals are almost eliminated. This table shows z-scores and their equivalent t scores.
T Score Conversion in Psychometrics
Calculating a t score is really just a conversion from a z score to a t score, much like converting Celsius to Fahrenheit. The formula to convert a z score to a t score is:
T = (Z x 10) + 50.
Example question: A candidate for a job takes a written test where the average score is 1026 and the standard deviation is 209. The candidate scores 1100. Calculate the t score for this candidate.
Note: If you are given the z-score for a question, skip to Step 2.
Step 1: Calculate the z score. (See: How to calculate a z-score). The z-score for the data in this example question is .354.
Step 2: Multiply the z score from Step 1 by 10:
10 * .354 = 3.54.
Step 3: Add 50 to your result from Step 2:
3.54 + 50 = 53.54.
That’s it!
Tips:
- z-scores and t scores both represent standard deviations from the mean, but while “0” on a z-score is 0 standard deviations from the mean, a “50” on a t score represents the same thing. That’s because t scores use a mean of 50 and z-scores use a mean of 0.
- A t score of over 50 is above average; below 50 is below average. In general, a t score of above 60 means that the score is in the top one-sixth of the distribution; above 63, the top one-tenth. A t score
below 40 indicates a lowest one-sixth position; below 37, the bottom one-tenth.
References
Levine, D. (2014). Even You Can Learn Statistics and Analytics: An Easy to Understand Guide to Statistics and Analytics 3rd Edition. Pearson FT Press