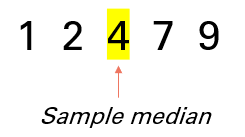
The sample median is the “middle” of a set of ordered sample data. For example, let’s say you had a sample of 5 data points: 1, 2, 4, 7, and 9. The sample median is the center number:

How to Find the Sample Median
In general, place the numbers in order from smallest to largest, then find the middle number. However, the exact formula you use depends on if you have an even set of numbers, or an odd set of numbers [1]:
- Even set of data points: Average of the values in positions n/2 and n/2 + 1,
- Odd set of data points: The value in position (n + 1)/2.
Where “n” is the number of data points.
Watch the video for two examples with an odd set of numbers and an even set of numbers:
Advantages and Disadvantages of the Sample Median
One advantage of the sample median over the sample mean is that as you’re only using the two middle numbers, the statistic isn’t affected by outliers.
The sample median can be a good measure of central tendency if is your data is from a skewed distribution. If you have a symmetric distribution (like a normal distribution), the sample mean may be a better choice.
Test for the Sample Median
The more data points (“n”) you have in a sample, the closer your sample median is going to be to the true population median. But you may want to know with a measure of certainty that your calculated statistic is equal to a true population value. In order to do this, run a one sample median test.
References
[1] Sheldon M. Ross, in Introduction to Probability and Statistics for Engineers and Scientists (Fifth Edition), 2014