Statistics Definitions > Order Statistics
Order Statistics Definition
Order statistics are sample values placed in ascending order. The study of order statistics deals with the applications of these ordered values and their functions.
Let’s say you had three weights:
X1 = 22 kg, X2 = 44 kg, and X3 = 12 kg.
To get the order statistics (Yn), put the items in numerical increasing order:
- Y1 = 12 kg
- Y2 = 22 kg
- Y3 = 44 kg
The kth smallest X value is normally called the kth order statistic.
More formally,
If X1, X2,…, Xn are random iid observations taken from a population with n continuous observations, the random variables
Y1 < Y2 < …, < Yn
denote the sample’s order statistics.
The term can also refer to statistics that depend only on the order of the values, and not on the values themselves. So while the median is an order statistic (it’s the middle value when a set of values is ordered from smallest to largest), the mean is not (as you have to work with the actual values).
Note: I’ve used Yn here to differentiate the set of ordered values from the original sample values. However, some authors use Xn to denote the original values and X(n) for the order statistics. Whether you use Yn or X(n) is a matter of personal choice (and perhaps, the wishes of your professor).
First and Second Order Statistics
The first order statistic is the smallest sample value (i.e. the minimum), once the values have been placed in order. For example, in the sample 9, 2, 11, 5, 7, 4 the first order statistic is 2. In notation, that’s x(1) = 2.
The second order statistic x(2) is the next smallest value. In the same sample, the second order statistic is 4.
Similarly, Yn is the maximum value in a sample. “n” is statistical notation for the number of items in a sample. In other words, once you’ve placed your sample items in order, the nth value is the maximum. For example, let’s say you have these items: 3, 4, 5, 6, 9, 10, 22. There are 7 items, so n = 7. The 7th item in order, 22, is the maximum.
Continuous vs. Discrete Distributions
Note that the formal definition above only works for continuous variables. This prevents ties (e.g. two items that place 2nd). You could in theory have a set of X-values with ties (i.e. where X1 ≤ X2 … ≤ Xn). And in fact, some authors (e.g. Chen, n.d.; Zhu n.d.) do define order statistics that way. However, working with ordered statistics with tied values from a discrete distribution is far more complex than values from a continuous distribution (DasGupta, n.d.).
Similarly, while there has been some advancement in deriving order statistics from independent nonidentically distributed data, this field is in its infancy and is much more complex than using iid variables.
Special Cases
Some statistics that can be defined in terms of order statistics include:
- The minimum of a set of numbers: the first number when the items are placed in numerical ascending order. The minimum, along with the maximum, are used in extreme value theory. They are of particular importance to the study of product failure, droughts, floods and other extreme occurrences.
- The first quartile (sometimes called the lower quartile), Q1: the value at the 25th percentile.
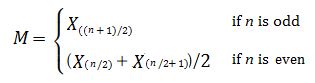
- The median: the middle number. One half of sample observations will fall below the median and one half will be above the median. In terms of order statistics, the median is defined as:
- The third quartile (sometimes called the upper quartile), Q3: the value at the 75th percentile.
- The maximum: the last ordered number (i.e. the highest).
- The Interquartile Range: the difference between the first and third quartiles (Q3 – Q1).
The range of a data set is a function of the order. This means that the range (maximum – minimum or R = Xn − X1)) is dependent on the ordered numbers in the set, and that it will differ for every set. The interquartile range, median, midrange and quartiles are also functions of the order and so will differ depending on what numbers are in the set.
Rank-Order Statistics
While order statistics use the original values in order, rank-order statistics only use the ranks of the ordered observations (David & Nagaraja, 2004). Therefore, the two statistics are quite different, even though they have similar labels. An example of rank-order statistics in use is the Wilcoxon signed rank test, which tests if the medians of two samples are equal. Most rank-order statistics lead to non parametric (distribution free) procedures, while order statistics depend on the underlying population distribution.
References
Chen, H. Order Stat. Retrieved October 30, 2017 from: http://www.math.ntu.edu.tw/~hchen/teaching/StatInference/notes/lecture37.pdf
DasGupta, A. 6 Finite Sample Theory of Order Stat. and Extremes. Retrieved October 30, 2017 from: http://www.stat.purdue.edu/~dasgupta/orderstats.pdf
David, H. & Nagaraja, H. (2004). Order Statistics. John Wiley & Sons.
Hogg, R. V. and Craig, A. T. Introduction to Mathematical Statistics, 7th ed. New York: Macmillan, 2012.
Zhu, W. Order Stat. Article retrieved October 30, 2017 from: http://www.ams.sunysb.edu/~zhu/ams570/Lecture9_570.pdf